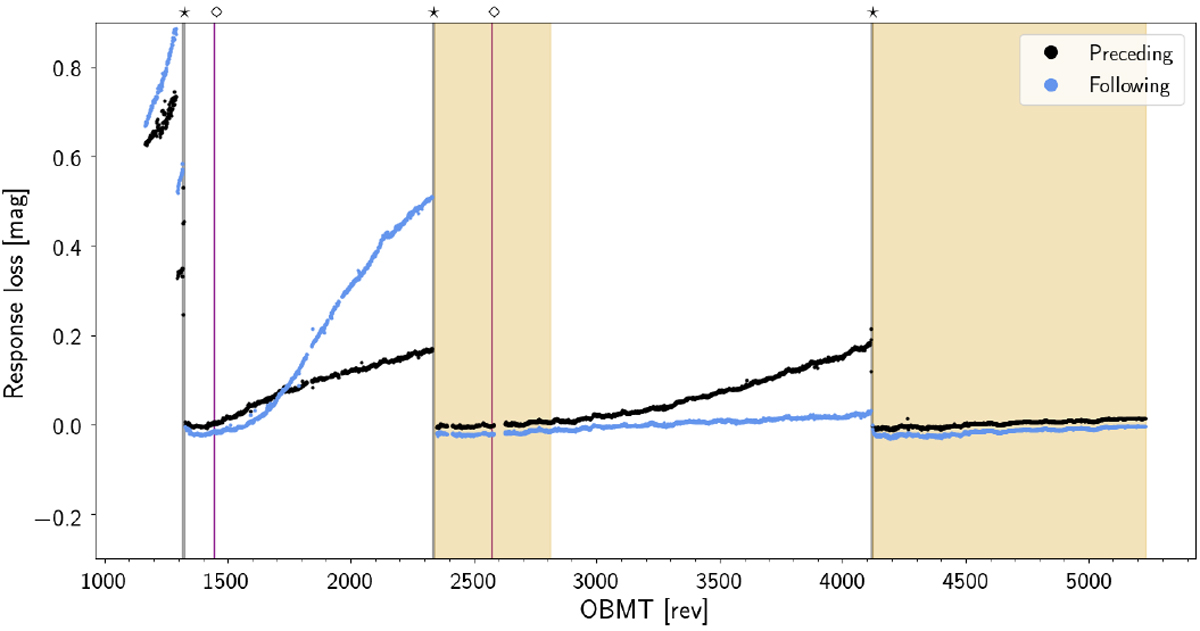
Fig. 5

Temporal evolution (expressed in units of satellite revolutions) of the response loss in BP due to contamination during the period covered by Gaia EDR3. The preceding FoV is shown in black, the following FoV is shown in light blue. The very thin grey shaded areas (marked with ⋆) are the three decontamination campaigns; the two vertical purple lines (marked with ◇) are the two refocussing events; the shaded orange areas show the two time ranges that constitute the INIT period.
Current usage metrics show cumulative count of Article Views (full-text article views including HTML views, PDF and ePub downloads, according to the available data) and Abstracts Views on Vision4Press platform.
Data correspond to usage on the plateform after 2015. The current usage metrics is available 48-96 hours after online publication and is updated daily on week days.
Initial download of the metrics may take a while.


