Fig. 4
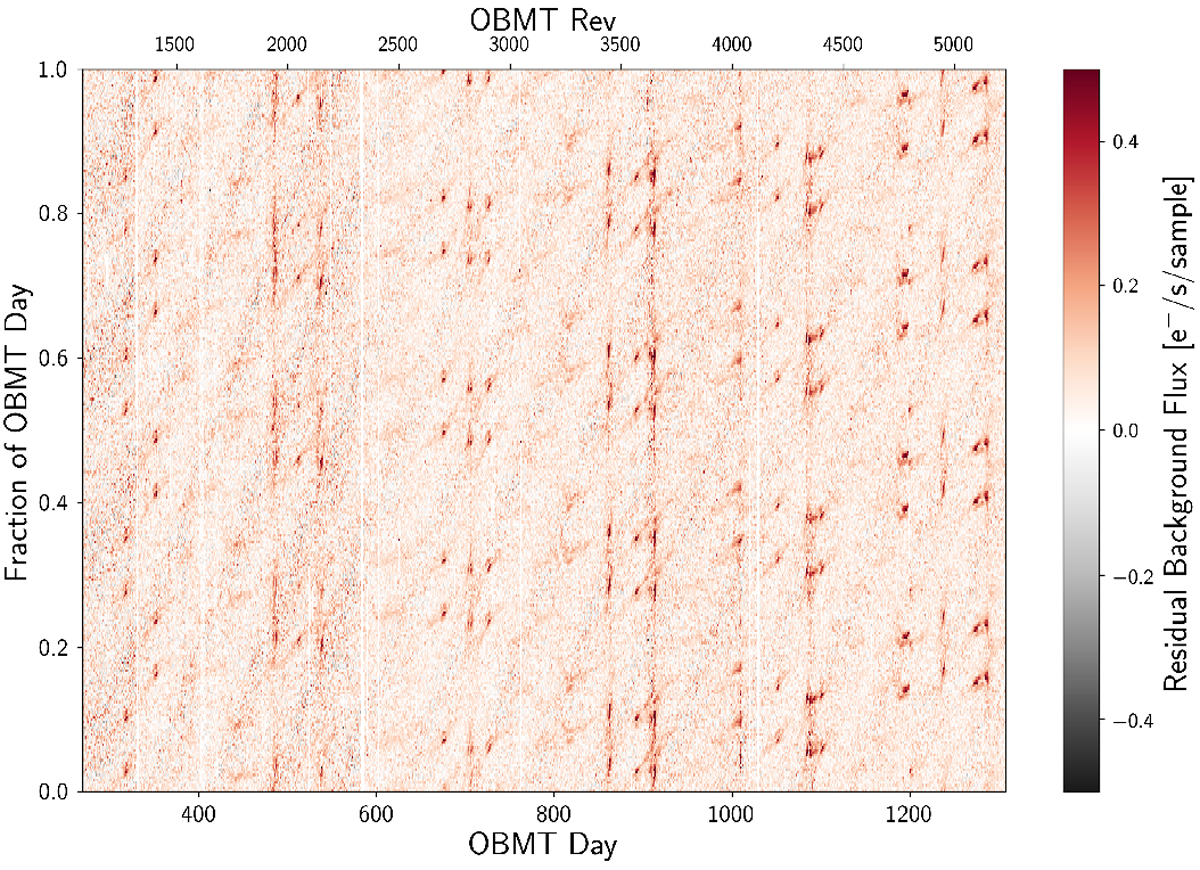
Temporal distribution of the residual background measurements in BP spectra. Each column in the heatmap shows the measurements within a given OBMT day for each OBMT day. The OBMT revolution is shown on the top abscissa axis for ease of interpretation. The high-residual features are the Galactic Plane crossing the two FoVs either in the Galaxy inner or outer direction (see the text for more details). The gaps related to major events such as decontamination and refocussing are visible. Other small gaps are due to telemetry data that could not be included in the processing for various reasons.
Current usage metrics show cumulative count of Article Views (full-text article views including HTML views, PDF and ePub downloads, according to the available data) and Abstracts Views on Vision4Press platform.
Data correspond to usage on the plateform after 2015. The current usage metrics is available 48-96 hours after online publication and is updated daily on week days.
Initial download of the metrics may take a while.