Fig. G.1
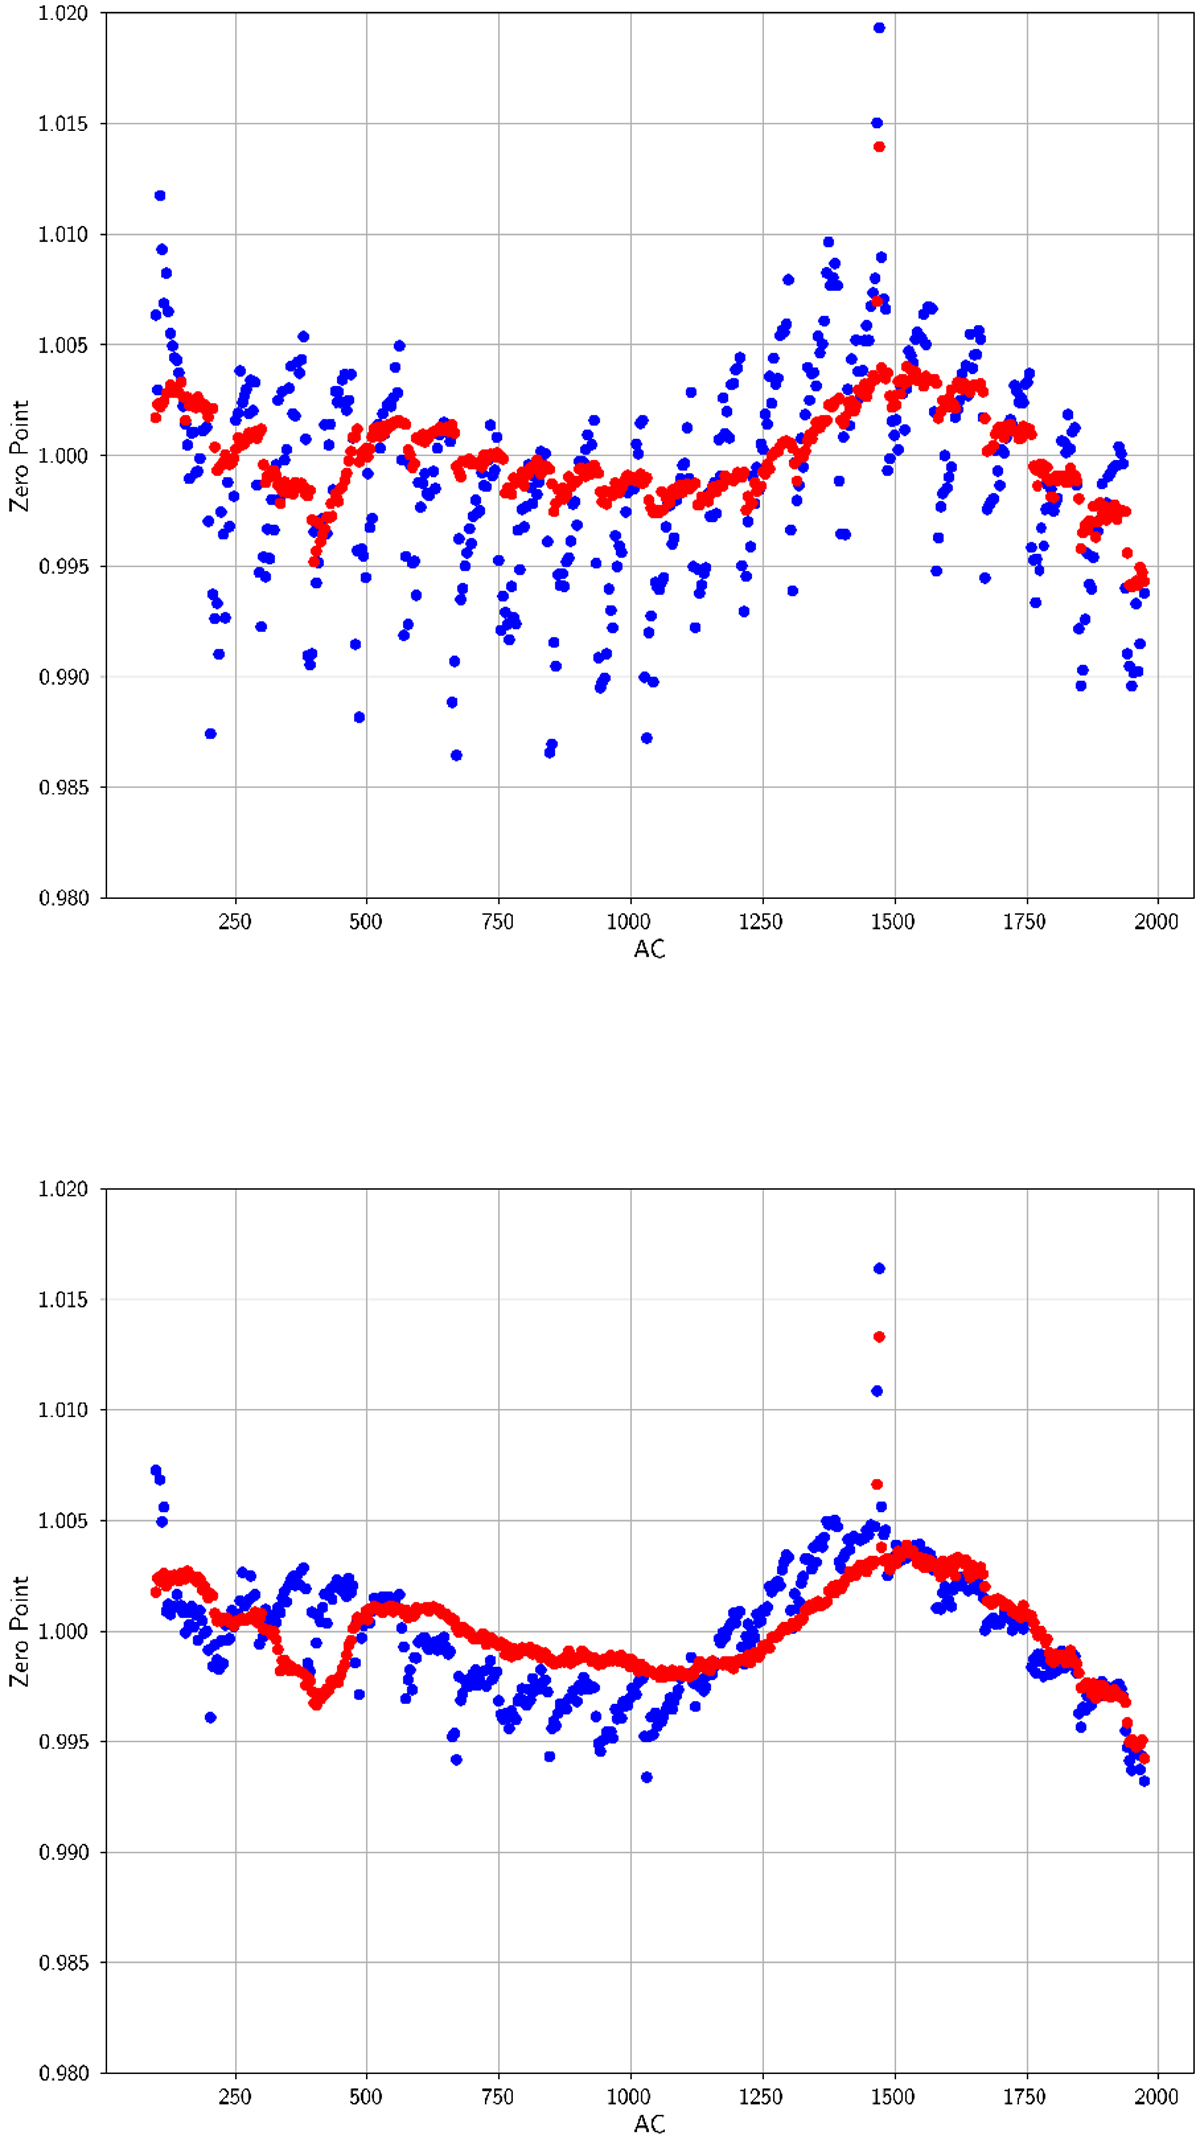
CCD response as a function of AC position as derived from the SS calibration. Top panel: response when the flux loss has been modelled and corrected only in the range ± 2 pix. Bottom panel: response when the flux loss has been modelled and corrected in the range ± 4 pix. The blue dots show the preceding FoV; the red dots show the following FoV.
Current usage metrics show cumulative count of Article Views (full-text article views including HTML views, PDF and ePub downloads, according to the available data) and Abstracts Views on Vision4Press platform.
Data correspond to usage on the plateform after 2015. The current usage metrics is available 48-96 hours after online publication and is updated daily on week days.
Initial download of the metrics may take a while.