Free Access
Fig. 32
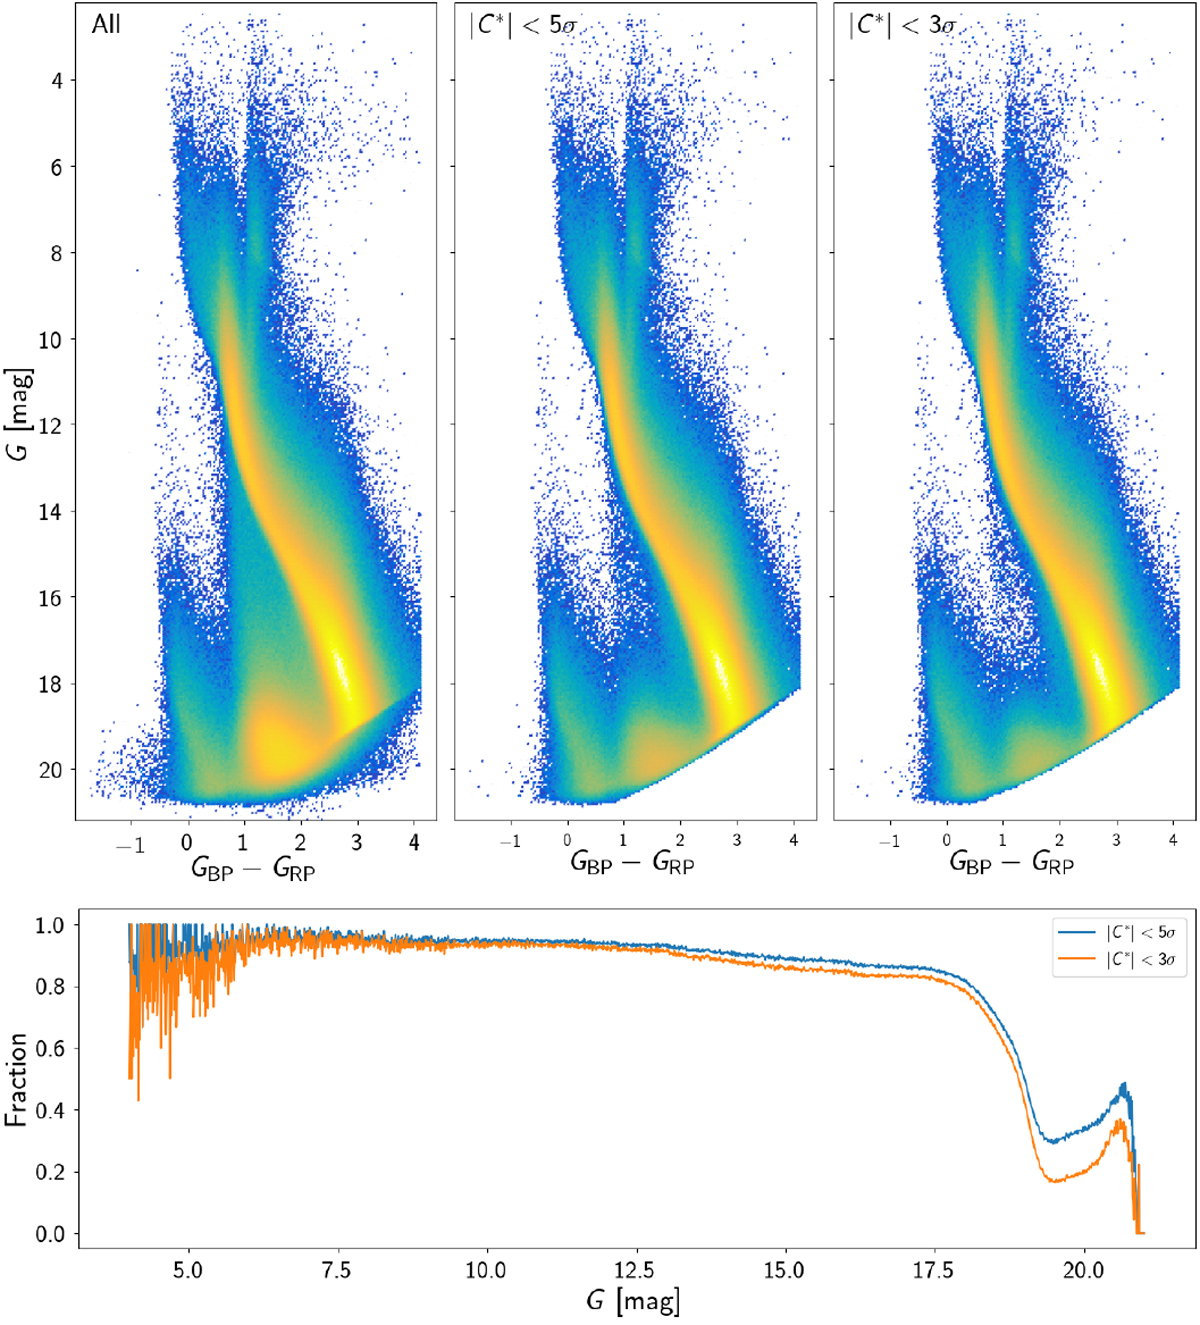
Colour–magnitude diagram for the nearby source sample for all sources with GBP <20.75 (left top panel), the subset of sources with |C*| smaller than 5σ (central top panel) and smaller than 3σ (right top panel). Bottom panel: fraction of sources selected using the two thresholds.
Current usage metrics show cumulative count of Article Views (full-text article views including HTML views, PDF and ePub downloads, according to the available data) and Abstracts Views on Vision4Press platform.
Data correspond to usage on the plateform after 2015. The current usage metrics is available 48-96 hours after online publication and is updated daily on week days.
Initial download of the metrics may take a while.