Fig. 31
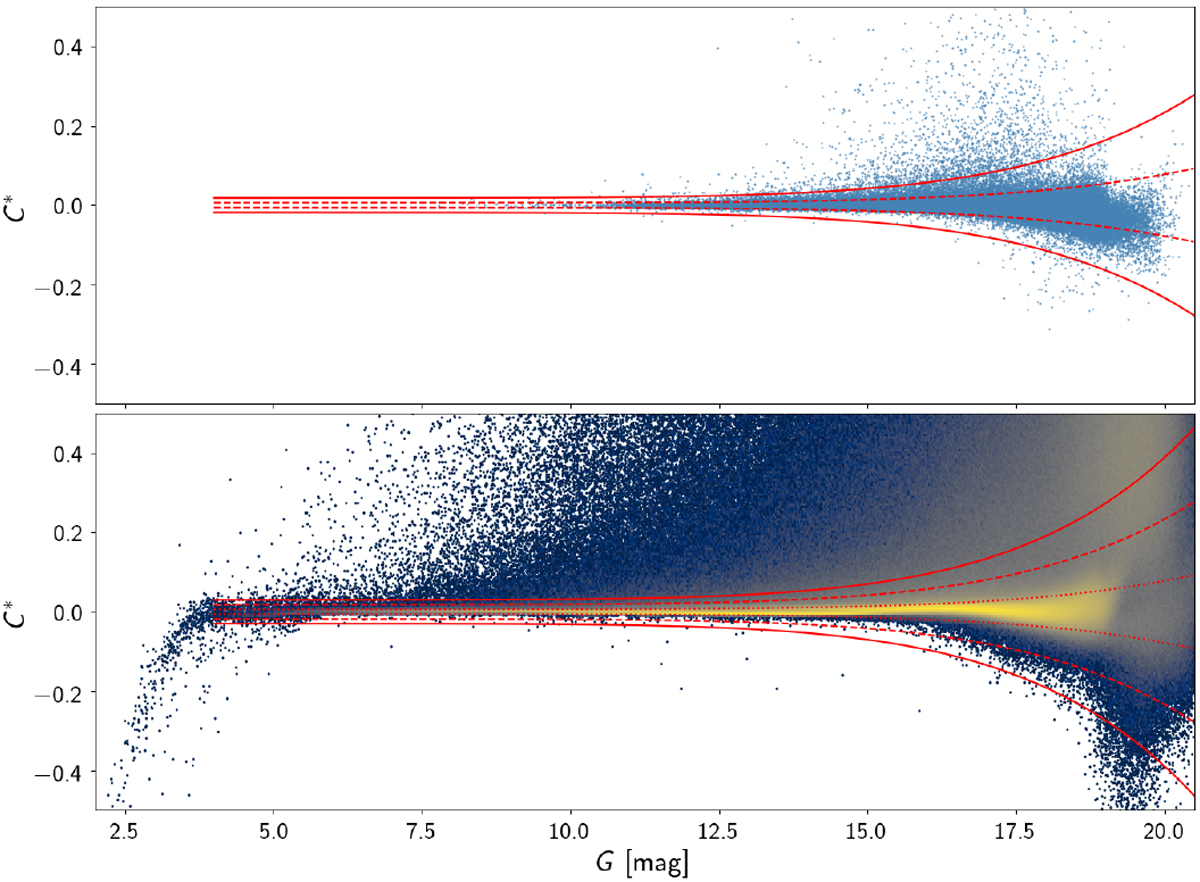
Corrected BP and RP flux excess vs. magnitude for the Stetson and Ivezic dataset (top panel) including the ± σ (solid) and ±3σ (dashed) scatter lines and for the nearby source dataset (bottom panel) including the ± σ (solid), ±3σ (dashed) and ±5σ (dotted) scatter lines. The scatter lines are defined by Eq. (18) with the fit coefficients provided in the text.
Current usage metrics show cumulative count of Article Views (full-text article views including HTML views, PDF and ePub downloads, according to the available data) and Abstracts Views on Vision4Press platform.
Data correspond to usage on the plateform after 2015. The current usage metrics is available 48-96 hours after online publication and is updated daily on week days.
Initial download of the metrics may take a while.