Fig. 29
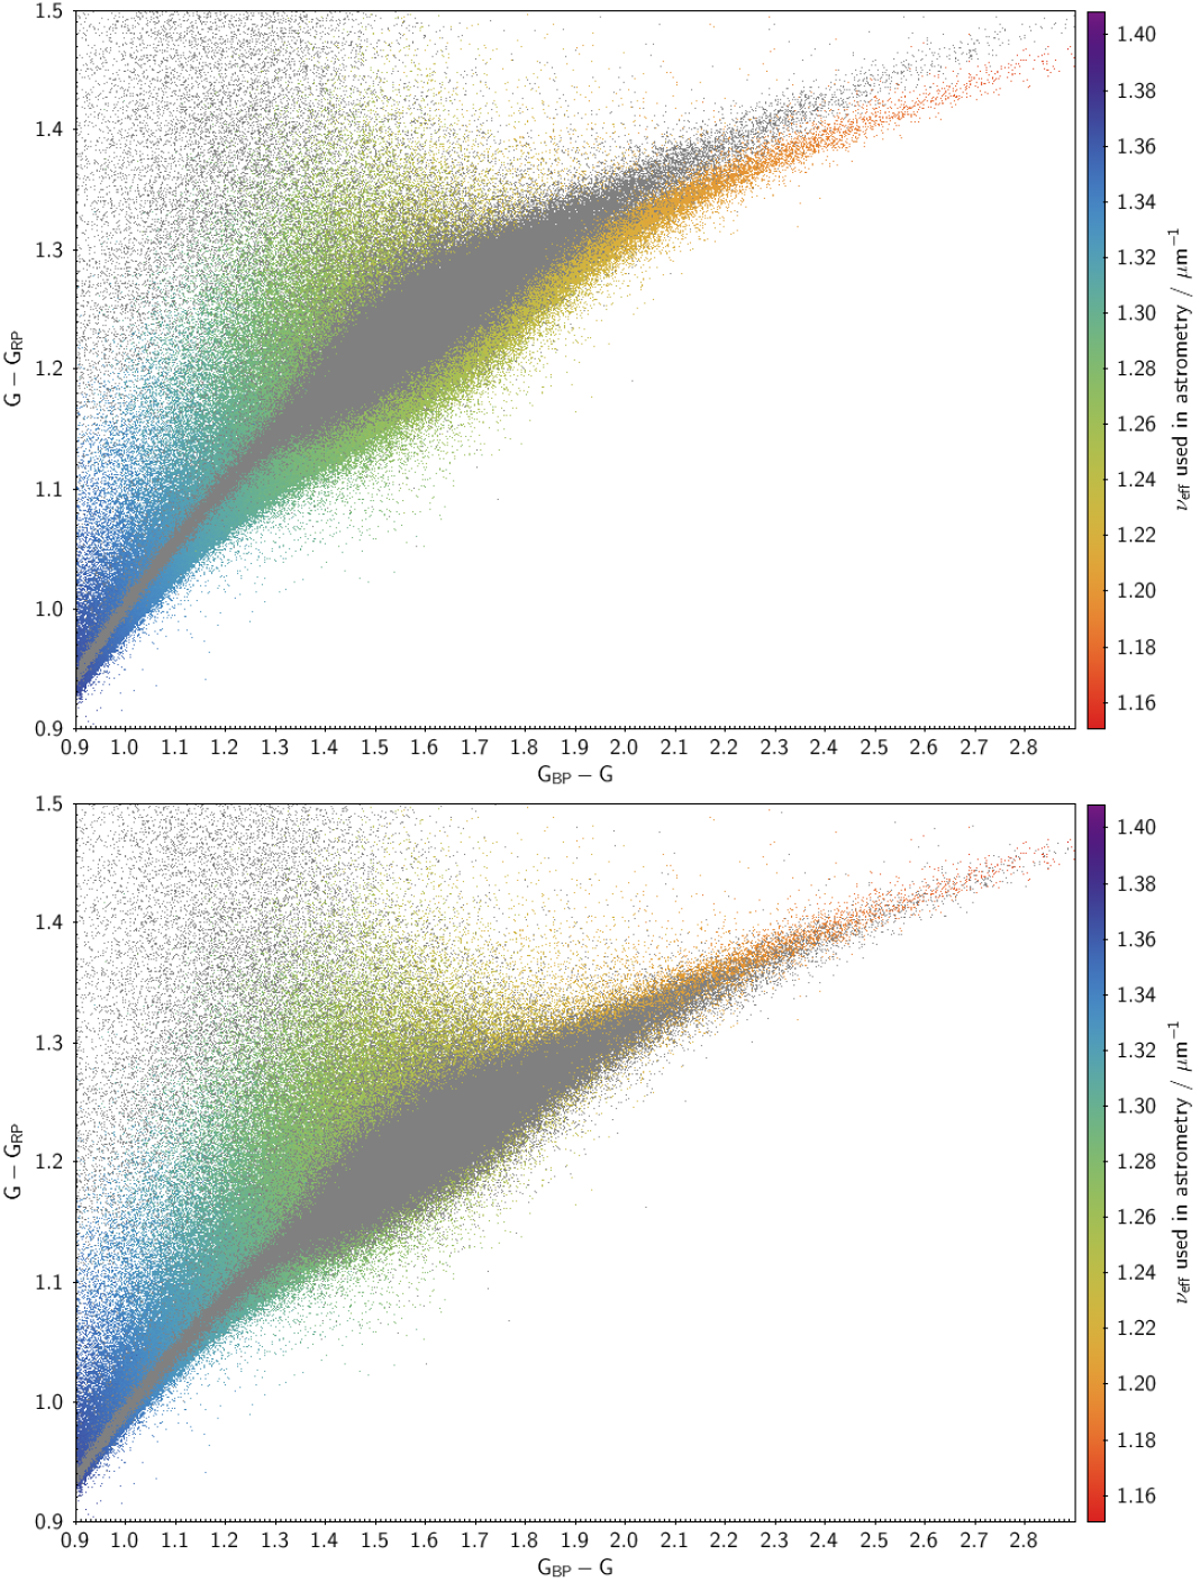
Effect of correcting the photometry of sources for which the IPD used a default colour. Top panel: a colour-colour diagram of the reddest main sequence stars in the local neighbourhood with parallax greater than 3 mas. The points are colour coded using the νeff value used inthe processing. If the default νeff was used, then the points are coloured grey. Bottom panel: same sources but with corrected G-band photometry.
Current usage metrics show cumulative count of Article Views (full-text article views including HTML views, PDF and ePub downloads, according to the available data) and Abstracts Views on Vision4Press platform.
Data correspond to usage on the plateform after 2015. The current usage metrics is available 48-96 hours after online publication and is updated daily on week days.
Initial download of the metrics may take a while.