Fig. 27
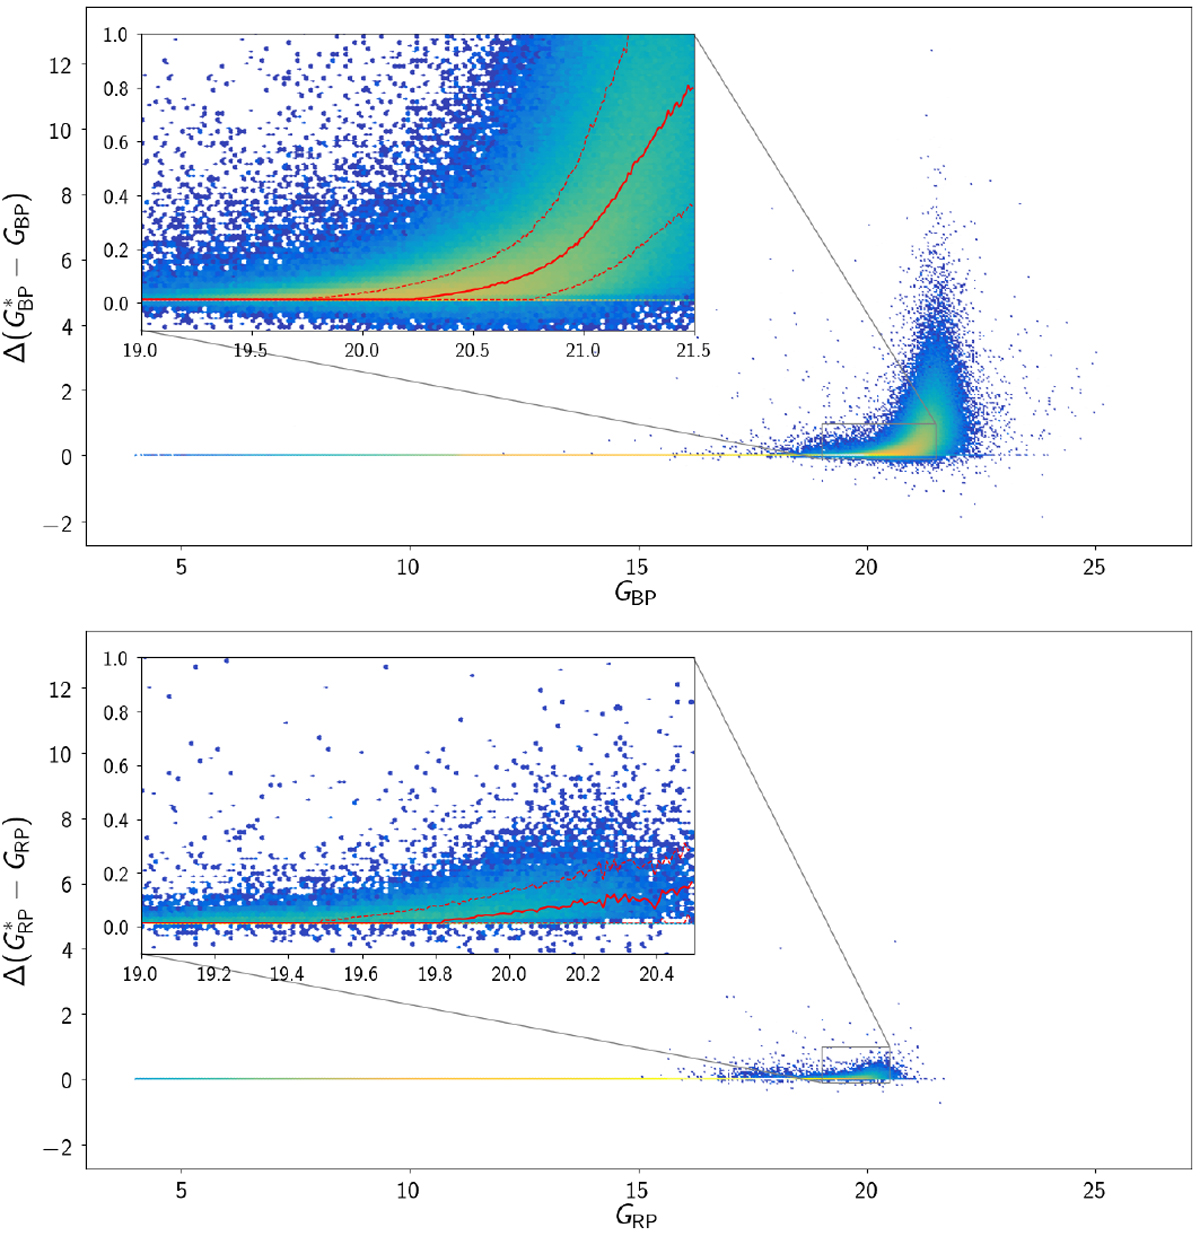
Change in the GBP (top panel) and GRP (bottom panel) magnitude when removing the 1 e−s−1 flux threshold vs. GBP and GRP magnitude spectively for the sample of ≈3.4 million nearby sources. The insets show a zoom of the transition region where the discrepancy between the two magnitudes becomes significant. The solid red lines show the median of the residual distribution, and the two red dashed lines show the 84th and 16th percentiles.
Current usage metrics show cumulative count of Article Views (full-text article views including HTML views, PDF and ePub downloads, according to the available data) and Abstracts Views on Vision4Press platform.
Data correspond to usage on the plateform after 2015. The current usage metrics is available 48-96 hours after online publication and is updated daily on week days.
Initial download of the metrics may take a while.