Fig. 26
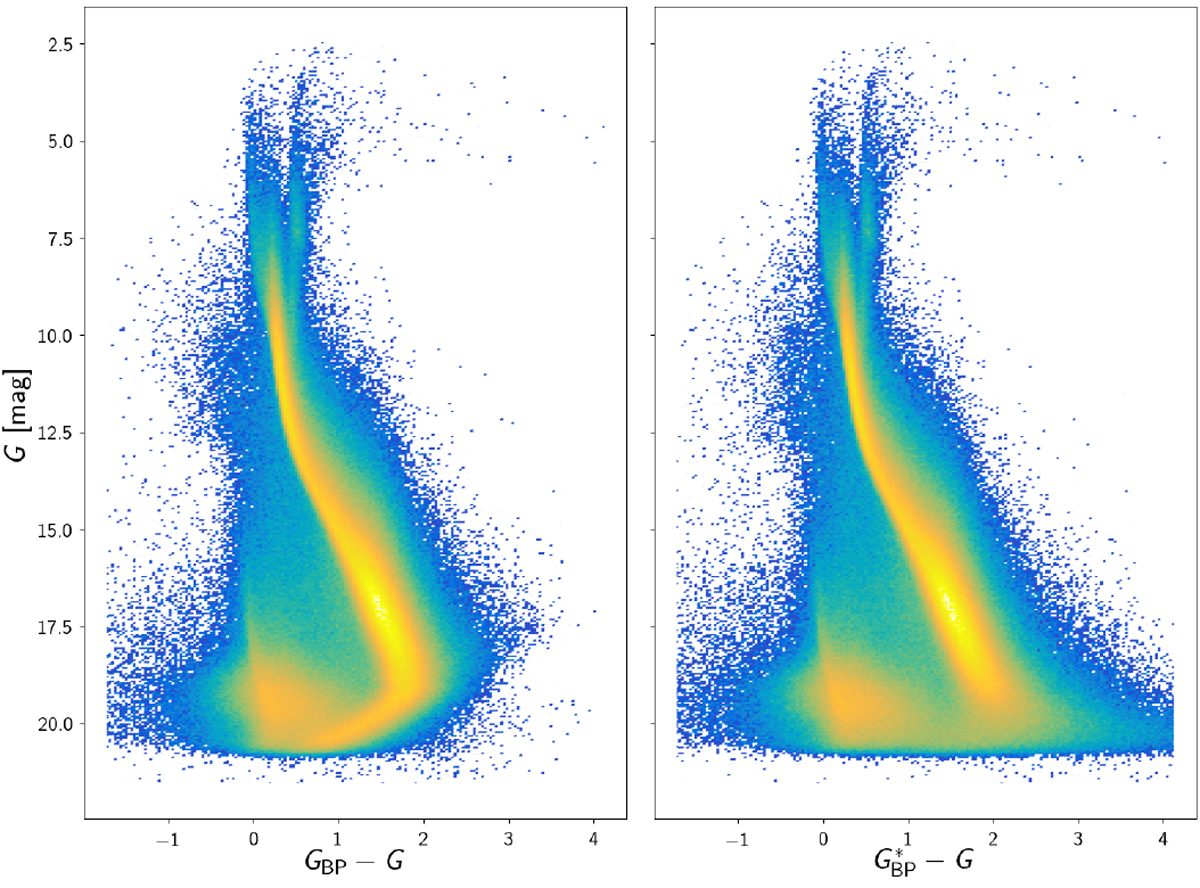
Colour–magnitude diagram for a sample of ≈3.4 million nearby sources selected from the Gaia EDR3 archive. Left panel: CMD produced using the G and GBP magnitudes from the Gaia EDR3 archive, which presents a tail like feature bending progressively towards bluer colours for fainter G
magnitudes. Right panel: CMD for the same sources but with ![]() recomputed without the low flux threshold.
recomputed without the low flux threshold.
Current usage metrics show cumulative count of Article Views (full-text article views including HTML views, PDF and ePub downloads, according to the available data) and Abstracts Views on Vision4Press platform.
Data correspond to usage on the plateform after 2015. The current usage metrics is available 48-96 hours after online publication and is updated daily on week days.
Initial download of the metrics may take a while.