Fig. 23
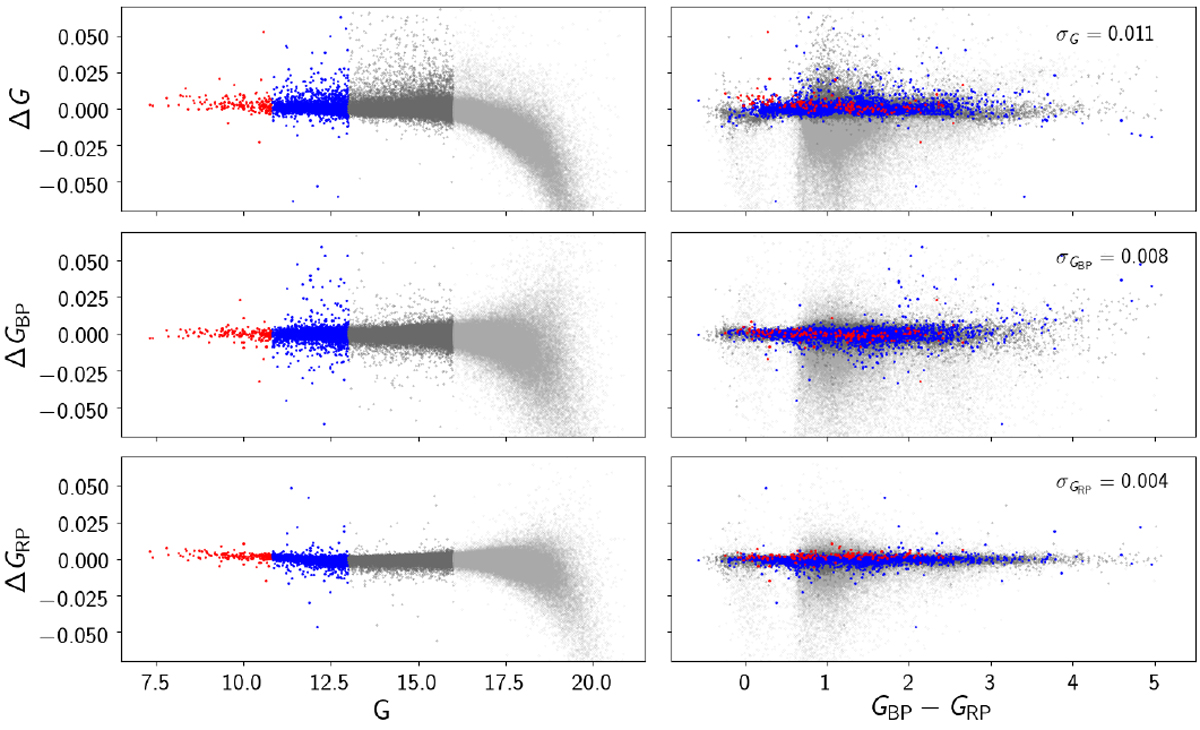
Residuals between Gaia EDR3 photometry and synthetic magnitudes obtained with the final passbands and computed for a sample of ~100 000 SEDs obtained from externally calibrated BP and RP spectra for G (top), GBP (middle), GRP (bottom) as function of G magnitudes (left) and GBP − GRP (right). The colours red, blue, dark, and light grey indicate sources with G < 10.8, 10.8 < G < 13, 13 < G < 16, and G > 16, respectively.
Current usage metrics show cumulative count of Article Views (full-text article views including HTML views, PDF and ePub downloads, according to the available data) and Abstracts Views on Vision4Press platform.
Data correspond to usage on the plateform after 2015. The current usage metrics is available 48-96 hours after online publication and is updated daily on week days.
Initial download of the metrics may take a while.