Fig. 20
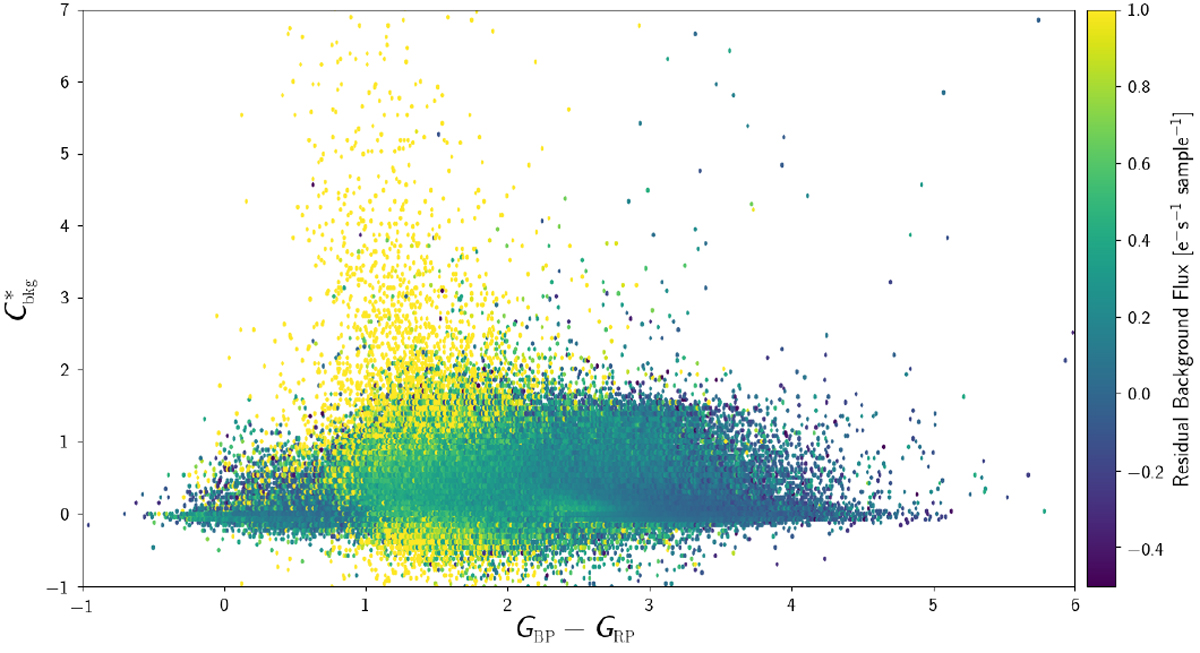
Corrected BP and RP flux excess vs. GBP − GRP
colour distribution for a selection of nearby sources with magnitude G > 17 and more than five calibrated epoch spectra in both BP and RP. In this plot the corrected flux excess
![]() has been computed after removing the median background residual flux for both BP and RP for each source. Sources are colour-coded by the median residual background as in the top panel of Fig. 19. See Table 1 for an estimate of the impact of the residual background flux at different magnitudes.
has been computed after removing the median background residual flux for both BP and RP for each source. Sources are colour-coded by the median residual background as in the top panel of Fig. 19. See Table 1 for an estimate of the impact of the residual background flux at different magnitudes.
Current usage metrics show cumulative count of Article Views (full-text article views including HTML views, PDF and ePub downloads, according to the available data) and Abstracts Views on Vision4Press platform.
Data correspond to usage on the plateform after 2015. The current usage metrics is available 48-96 hours after online publication and is updated daily on week days.
Initial download of the metrics may take a while.