Fig. 2
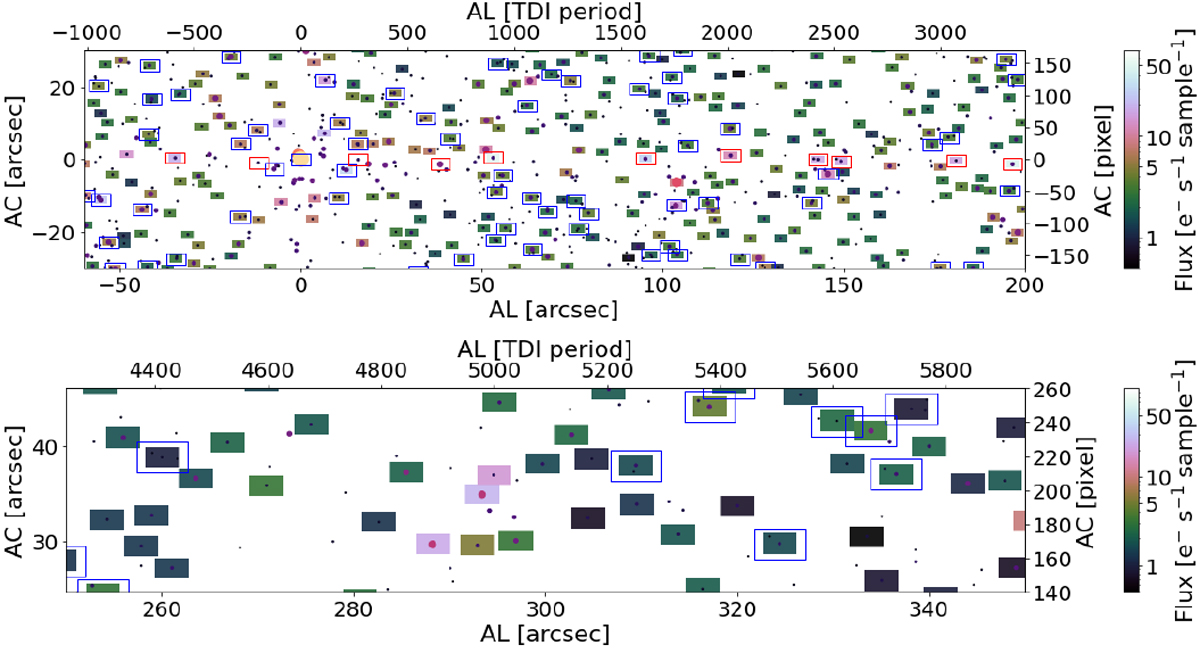
Example of the computed scene for a short time range. Top panel: scene and transits for a small stretch of data (≈ 12 seconds or ≈4.5 arcmin AL and ≈1 arcmin AC). Bottom panel: zoom-in of a small group of scene objects and transits around two sources of magnitude close to 13. In both panels, the colour coding of the rectangular symbols representing the actual observations is by residual background flux measured in e− s−1 sample−1. The sources in the scene are represented by filled circles with size and colour proportional to their magnitude. The colour bar in the plot refers to the colour coding used for the observations (see the text for more details).
Current usage metrics show cumulative count of Article Views (full-text article views including HTML views, PDF and ePub downloads, according to the available data) and Abstracts Views on Vision4Press platform.
Data correspond to usage on the plateform after 2015. The current usage metrics is available 48-96 hours after online publication and is updated daily on week days.
Initial download of the metrics may take a while.