Fig. 19
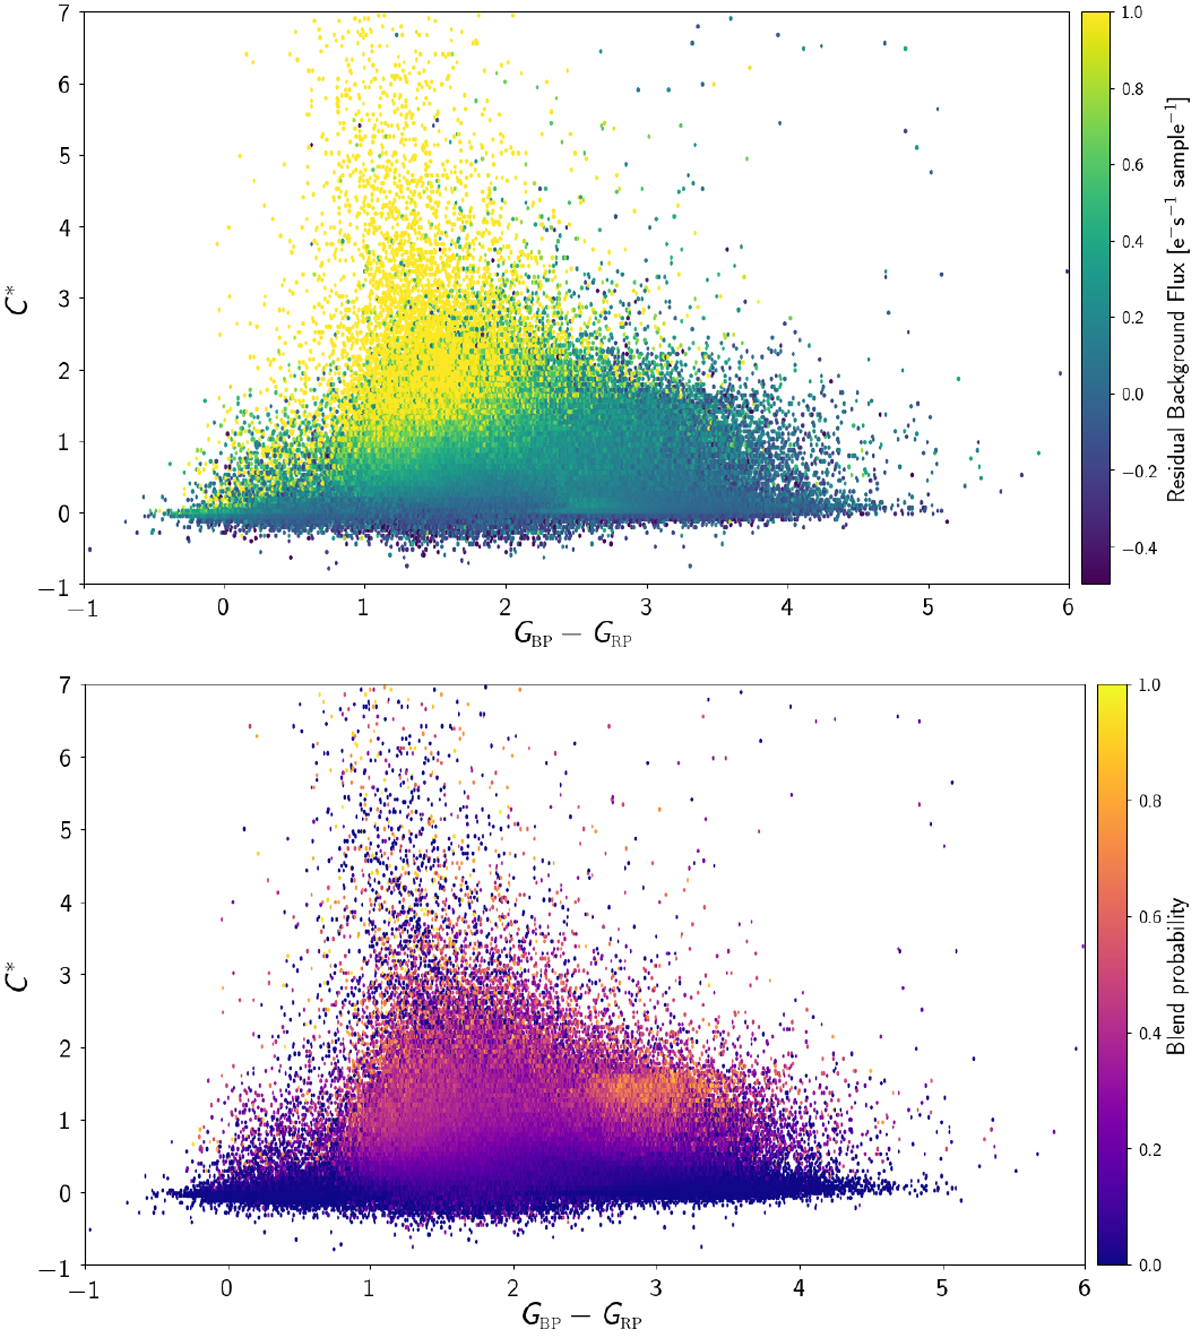
Effect of residual background flux and blending probability on the corrected BP and RP flux excess. Top panel: distribution of corrected BP and RP flux excess vs. GBP −GRP colour for a subset of nearby sources fainter than 17 in G-band. The symbols are colour coded by the source median residual background as measured from the BP spectra. Bottom panel: distribution of corrected BP and RP flux excess vs. GBP −GRP colour for the same sources shown in the top panel but colour-coded by blend probability (see text for details). For these plots sources have been further selected to retain sources where the blend probability for BP and RP was in agreement to within 50%.
Current usage metrics show cumulative count of Article Views (full-text article views including HTML views, PDF and ePub downloads, according to the available data) and Abstracts Views on Vision4Press platform.
Data correspond to usage on the plateform after 2015. The current usage metrics is available 48-96 hours after online publication and is updated daily on week days.
Initial download of the metrics may take a while.