Fig. 18
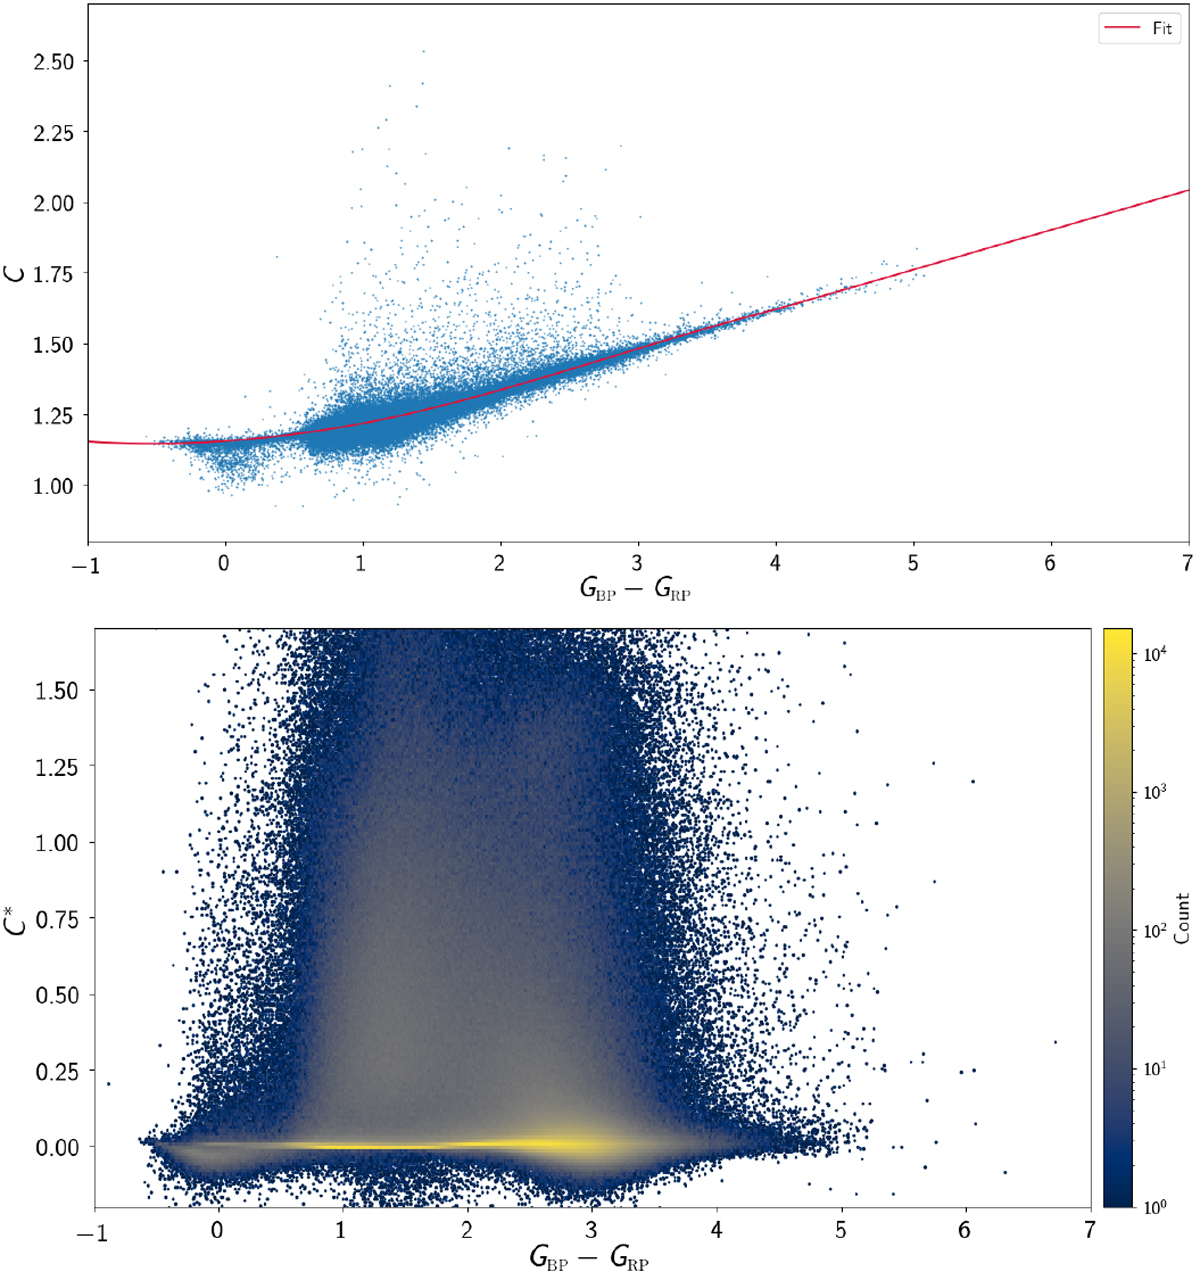
Determination of the BP and RP flux excess dependence on GBP − GRP colour and its application to define the corrected excess factor C*. Top panel: BP and RP flux excess vs. GBP − GRP colour for the set of standard sources from Stetson (2000) secondary standards and Ivezić et al. (2007). The red line represents the combined fit based on two different polynomials for the bluer-end and the central region and a linear fit for the red-end. Bottom panel: corrected flux excess factor C* vs. GBP − GRP colour for a set of nearby sources selected from the Gaia EDR3 archive.
Current usage metrics show cumulative count of Article Views (full-text article views including HTML views, PDF and ePub downloads, according to the available data) and Abstracts Views on Vision4Press platform.
Data correspond to usage on the plateform after 2015. The current usage metrics is available 48-96 hours after online publication and is updated daily on week days.
Initial download of the metrics may take a while.