Fig. 14
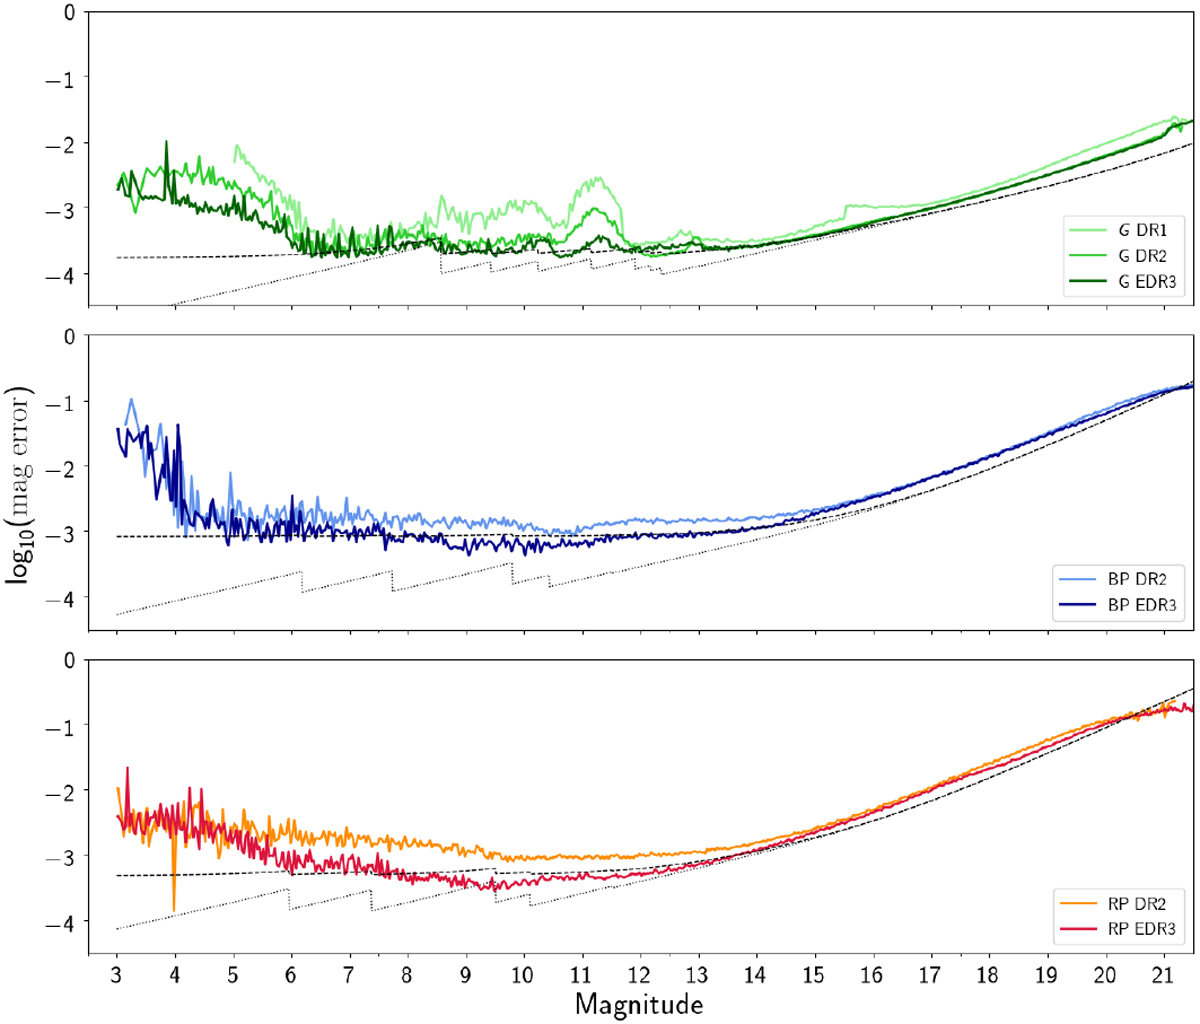
Distribution of the uncertainty on the weighted mean G (top panel), GBP (central panel), and GRP (bottom panel) as a function of the G, GBP, and GRP magnitude, respectively. Only sources with ≈20 transits (corresponding to ≈200 CCD observations in G) have been included in this analysis. The black dotted line shows the expected uncertainties for sources with 200 G-band (20 GBP, GRP) contributions for a nominal mission with no calibration error. The dashed dark line shows the same expected uncertainties with an additional calibration error on the single measurement of 2.0 mmag for G-band, 3.1 mmag for GBP and 1.8 mmag for GRP added in quadrature. The Gaia DR1 and DR2 uncertainties are shown for comparison.
Current usage metrics show cumulative count of Article Views (full-text article views including HTML views, PDF and ePub downloads, according to the available data) and Abstracts Views on Vision4Press platform.
Data correspond to usage on the plateform after 2015. The current usage metrics is available 48-96 hours after online publication and is updated daily on week days.
Initial download of the metrics may take a while.