Fig. 1
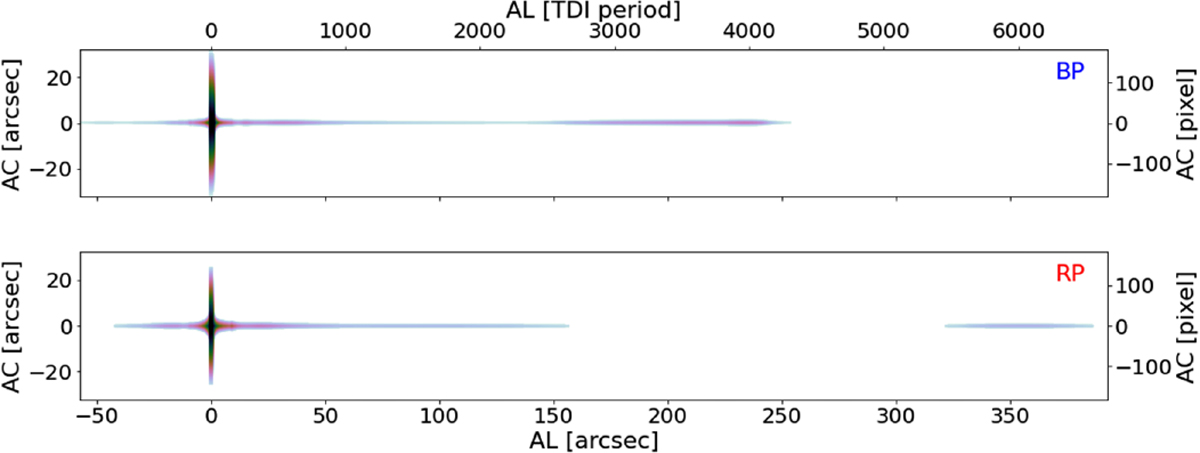
Reconstructed contamination due to an object of magnitude six placed at the coordinate origin. The 2D map is the result ofevaluating the AL and AC contamination profiles. A full 2D mapping will be done in the next release. BP contamination is shown in the top panel, RP in the bottom panel. For each location in the plot the colour corresponds to the contaminating flux expected in a window centred at that coordinate converted to magnitude for ease of interpretation.
Current usage metrics show cumulative count of Article Views (full-text article views including HTML views, PDF and ePub downloads, according to the available data) and Abstracts Views on Vision4Press platform.
Data correspond to usage on the plateform after 2015. The current usage metrics is available 48-96 hours after online publication and is updated daily on week days.
Initial download of the metrics may take a while.