Fig. 22
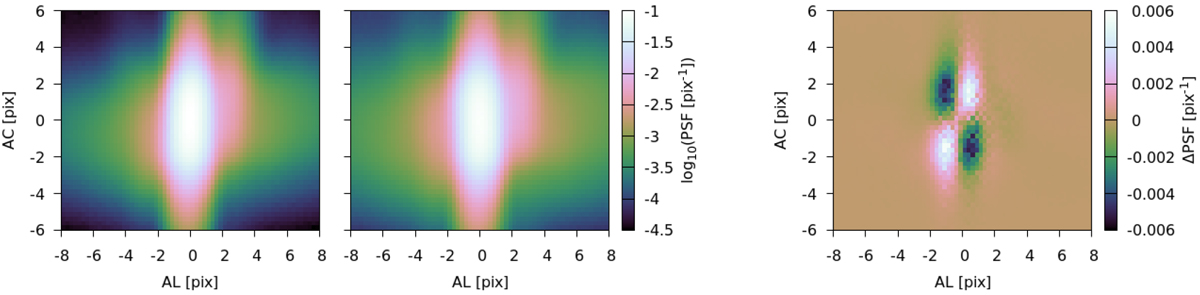
Effects of AC and AL rate variations on the observed PSF. The two panels on the left depict many stacked observations from FOV1 ROW1 AF6 gate 0, for two narrow ranges of AC rate at high negative (− 1.0 →−0.95 pix s−1 ; left) and high positive (0.95 → 1.0 pix s−1 ; middle) values. These reveal an apparent shear between the two PSFs that is clear in a plot of the difference (right panel). Thiseffect is induced by non-zero AL rate, as explained in the text.
Current usage metrics show cumulative count of Article Views (full-text article views including HTML views, PDF and ePub downloads, according to the available data) and Abstracts Views on Vision4Press platform.
Data correspond to usage on the plateform after 2015. The current usage metrics is available 48-96 hours after online publication and is updated daily on week days.
Initial download of the metrics may take a while.