Fig. 19
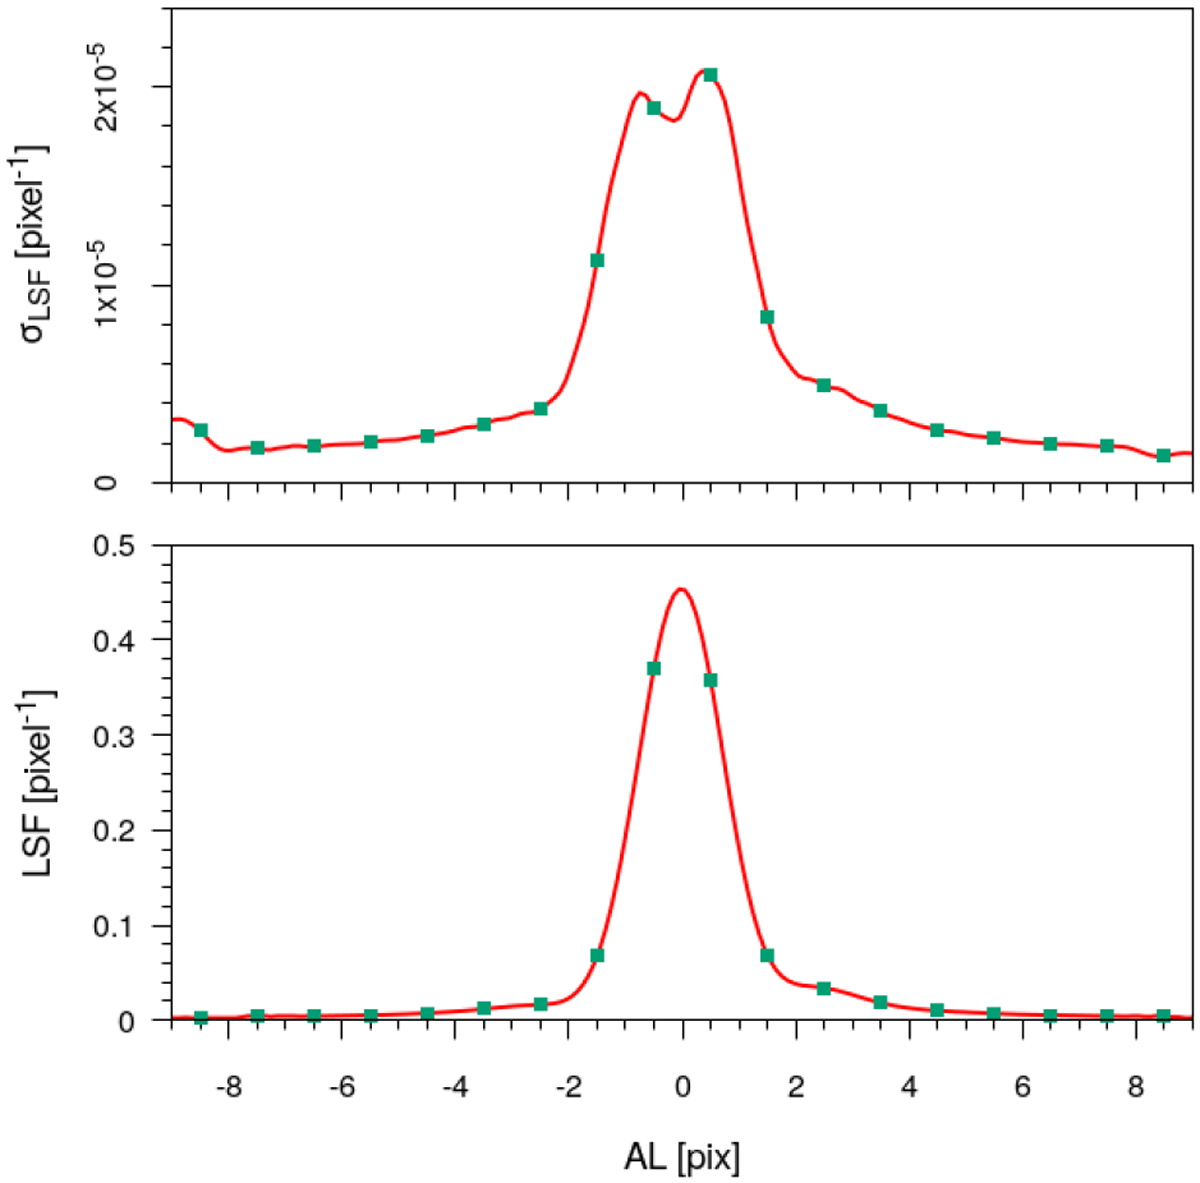
AL variation in the calibration errors for a single representative realisation of the LSF model. The top panel depicts the standard deviation of the LSF model from propagation of the covariance on the LSF parameters; the lower panel depicts the corresponding LSF value. There is notable structure in the top panel, as explained in the text. The green points correspond to the locations of the samples for which the full covariance matrix is shown in Fig. 20.
Current usage metrics show cumulative count of Article Views (full-text article views including HTML views, PDF and ePub downloads, according to the available data) and Abstracts Views on Vision4Press platform.
Data correspond to usage on the plateform after 2015. The current usage metrics is available 48-96 hours after online publication and is updated daily on week days.
Initial download of the metrics may take a while.