Fig. 6.
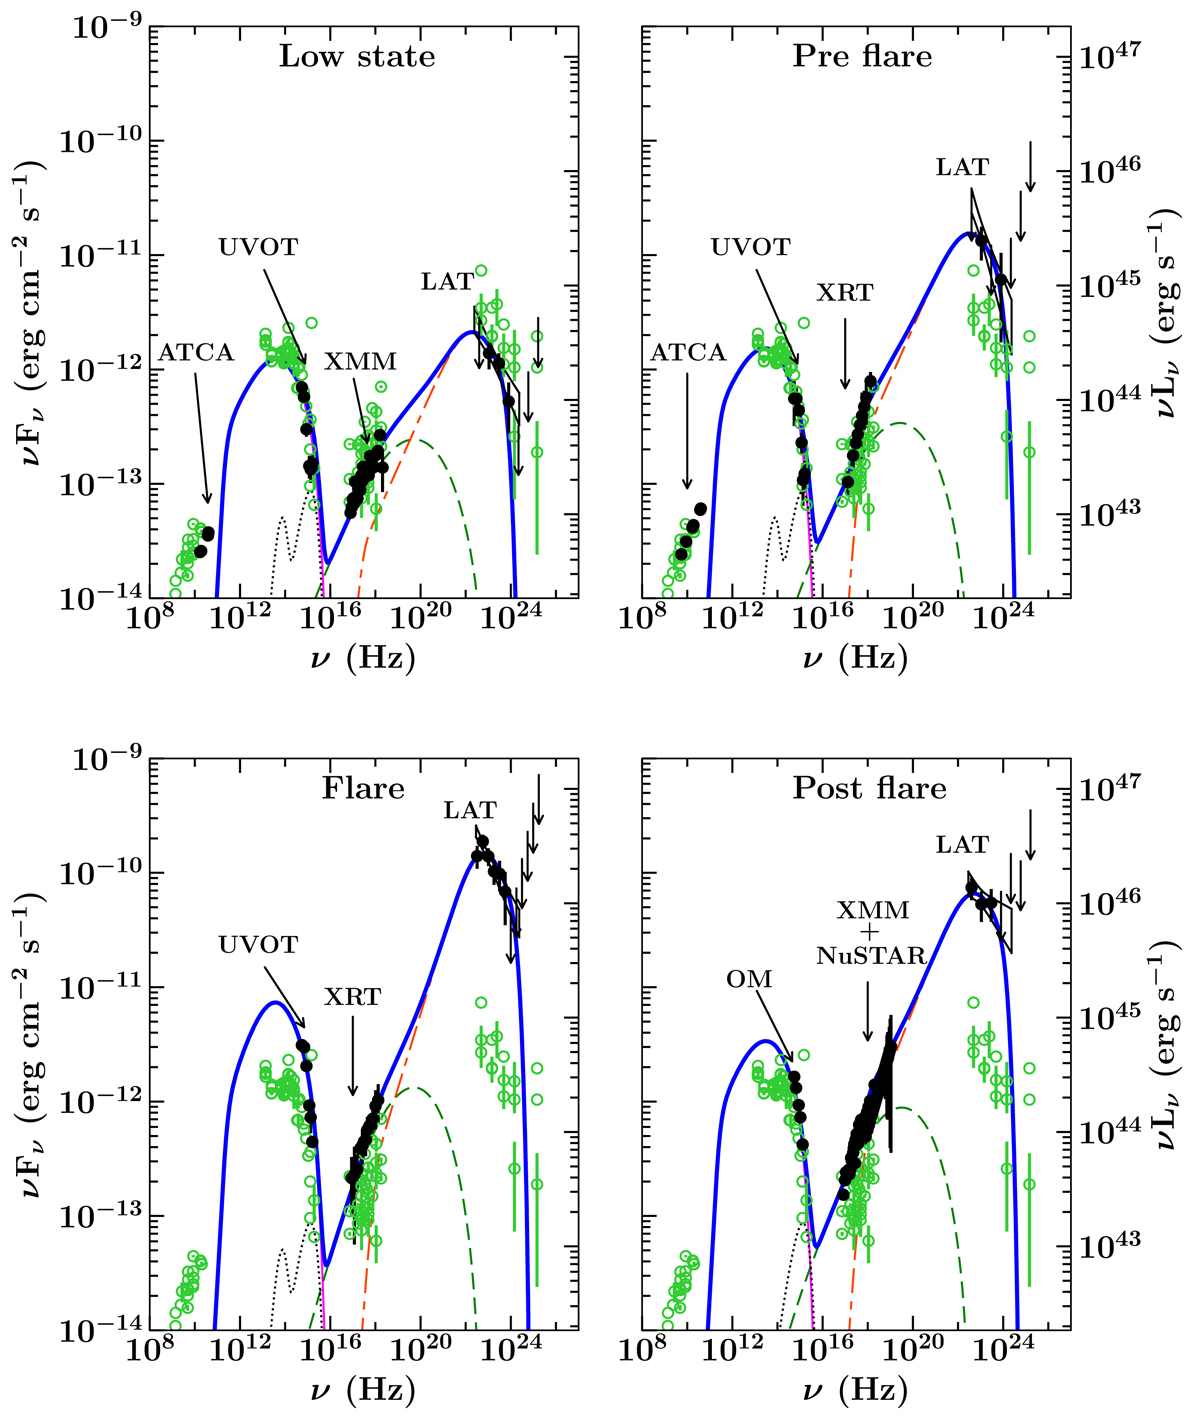
Spectral energy distribution of PKS 2004−447 for four stages modelled with a simple leptonic emission model. Open green circles refer to the archival measurements taken from the SSDC SED builder (https://tools.ssdc.asi.it/), whereas filled black circles represent the data analysed by us. The thin solid pink line shows the synchrotron emission. Dashed green and dash-dash-dot orange lines correspond to the synchrotron self Compton and external Compton processes, respectively. The dotted black line shows the thermal emission from the accretion disk and dusty torus. The thick solid blue line is the sum of all radiative components. The SEDs are sorted from left to right as follows: low (MJD 55682–56413), pre-flare (MJD 58754–58770), flaring (MJD 58781–58784), and post-flare activity states (MJD 58787–58789), as defined in the text. The model parameters are listed in Table 3.
Current usage metrics show cumulative count of Article Views (full-text article views including HTML views, PDF and ePub downloads, according to the available data) and Abstracts Views on Vision4Press platform.
Data correspond to usage on the plateform after 2015. The current usage metrics is available 48-96 hours after online publication and is updated daily on week days.
Initial download of the metrics may take a while.