Fig. 5.
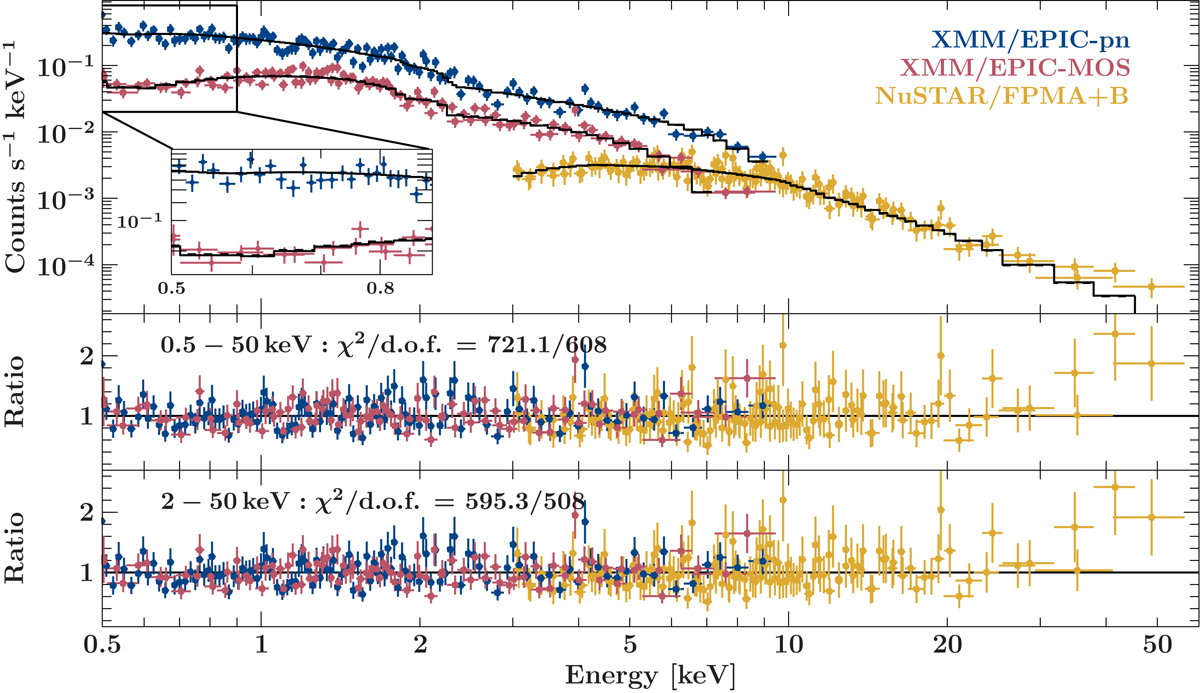
XMM-Newton and NuSTAR spectra with the best-fit results of an absorbed power-law model. For plotting purposed only the spectra are binned to a S/N of 5 and 3 for XMM-Newton and NuSTAR, respectively. Bins from the NuSTAR spectrum are only shown up to 50 keV, because at energies above this, no significant bin for the given S/N value is found. Upper panel: EPIC pn (blue), MOS (red) and FPMA/FPMB (yellow) data together with the best fits for the full (0.5−80 keV) energy range (solid line) as well as the hard (2−80 keV) energy range (dashed line). The zoom window shows small deviations between the fits of the full and the hard energy range. Middle panel: data-to-model ratio for the best fit to the full energy range. Lower panel: data-to-model ratio for the best-fit to the hard energy range with extrapolating the model down to 0.5 keV.
Current usage metrics show cumulative count of Article Views (full-text article views including HTML views, PDF and ePub downloads, according to the available data) and Abstracts Views on Vision4Press platform.
Data correspond to usage on the plateform after 2015. The current usage metrics is available 48-96 hours after online publication and is updated daily on week days.
Initial download of the metrics may take a while.