Free Access
Fig. 3.
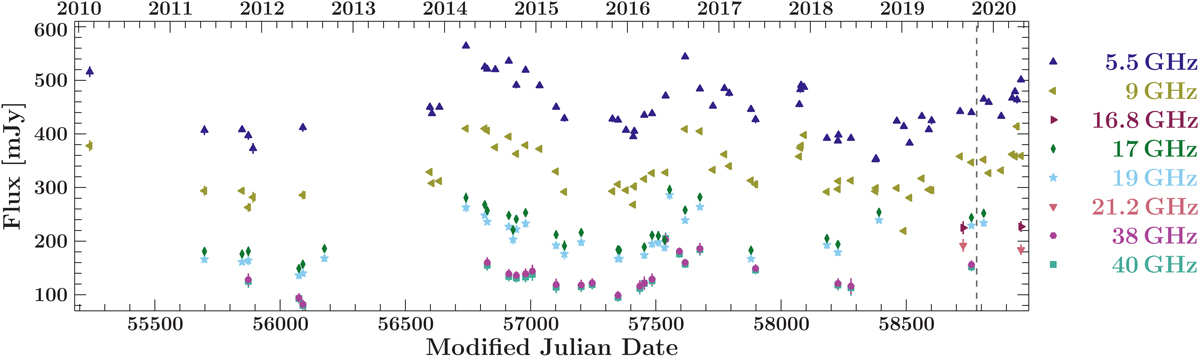
ATCA light curves taken from 2010−2020 in the λ4 cm (5.5 GHz, 9 GHz), λ15 mm (16.8 GHz, 17 GHz, 19 GHz, and 21.2 GHz) and λ7 mm band (38 GHz, 40 GHz). The time of the flare is marked by a dashed grey line.
Current usage metrics show cumulative count of Article Views (full-text article views including HTML views, PDF and ePub downloads, according to the available data) and Abstracts Views on Vision4Press platform.
Data correspond to usage on the plateform after 2015. The current usage metrics is available 48-96 hours after online publication and is updated daily on week days.
Initial download of the metrics may take a while.