Fig. 2.
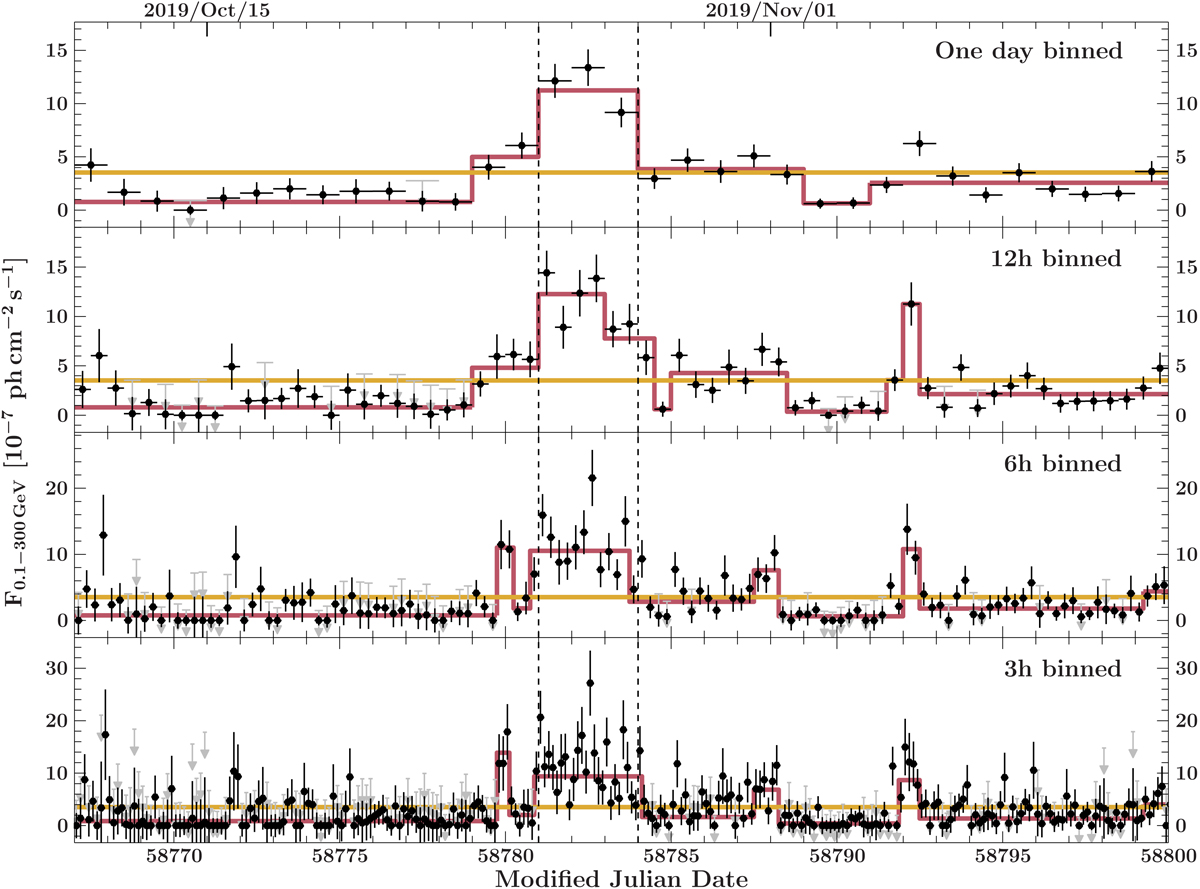
γ-ray light curves of PKS 2004−447 during the 2019 GeV flare for the different time binnings of the LAT data. Time bins with TS < 1 have an estimated error that was derived using their 1σ upper limit value. For those bins we show the 2σ upper limits in grey to visually show how many bins would have been rejected from the analysis otherwise. The Bayesian blocks are shown in red, while the baseline (average flux during the time range from 2019 October 10 to 2019 November 14) is shown in yellow. The dashed lines mark the time range chosen to construct the broadband SED of the flaring state.
Current usage metrics show cumulative count of Article Views (full-text article views including HTML views, PDF and ePub downloads, according to the available data) and Abstracts Views on Vision4Press platform.
Data correspond to usage on the plateform after 2015. The current usage metrics is available 48-96 hours after online publication and is updated daily on week days.
Initial download of the metrics may take a while.