Fig. 1.
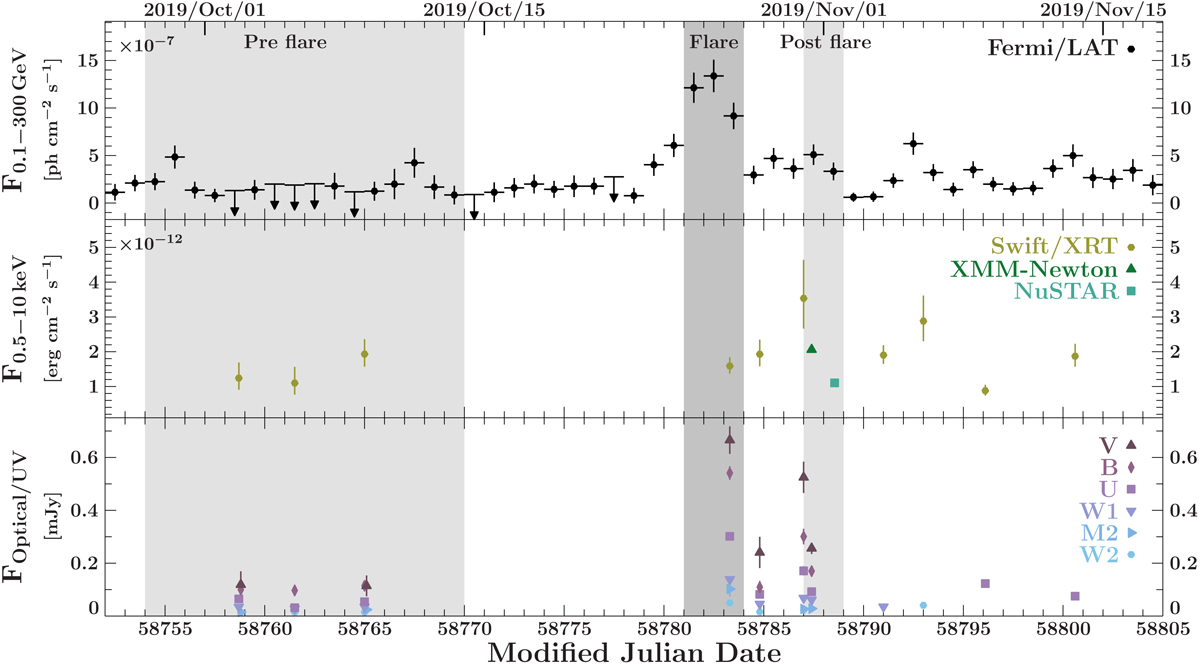
Light curves in the γ-ray (top), X-ray (middle), and UV/optical (bottom) regimes from 2019 September 27 until 2019 November 19. The Fermi/LAT light curve shows the daily binned flux of the bins with TS ≥ 1. LAT light curve bins with TS < 1 are represented as 2σ upper limit arrows. All errors represent the 1σ uncertainties. For NuSTAR, the flux is interpolated down to 0.5 keV. The dark-grey shadowed region marks the time range that is used for the flare SED, while the pre- and post-flare time ranges are shown in light grey.
Current usage metrics show cumulative count of Article Views (full-text article views including HTML views, PDF and ePub downloads, according to the available data) and Abstracts Views on Vision4Press platform.
Data correspond to usage on the plateform after 2015. The current usage metrics is available 48-96 hours after online publication and is updated daily on week days.
Initial download of the metrics may take a while.