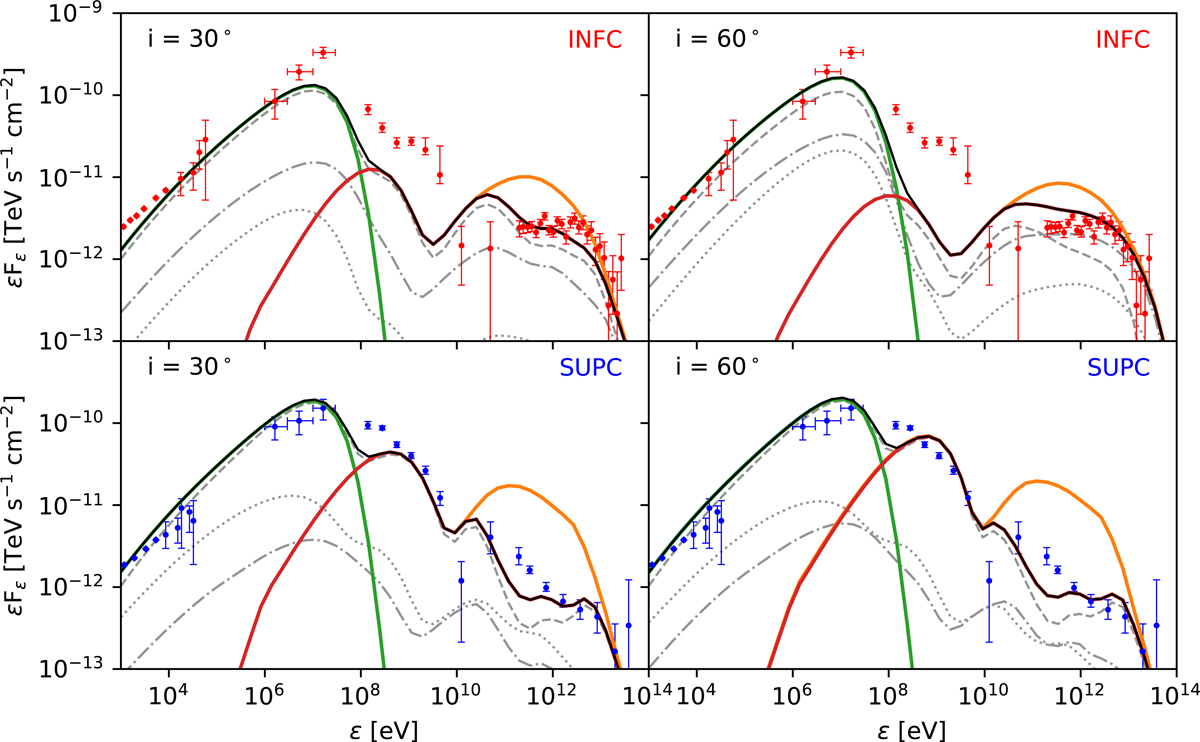
Fig. 7.

Spectral energy distribution of the emission predicted by our model for LS 5039 for different parts of the orbit and inclinations of the system. Different radiative processes are colour-coded: synchrotron (green lines), inverse Compton (orange), inverse Compton attenuated by γγ-absorption (red), and total (black). The contributions to the total emission from the inner (dashed lines), middle (dashed-dotted), and far regions (dotted) are shown separately (for a description of the regions, see the main text). The model predictions are shown together with observations in soft X-rays (Takahashi et al. 2009) as well as LE (Collmar & Zhang 2014), HE (Hadasch et al. 2012), and VHE (Aharonian et al. 2006) gamma-rays. Results are shown for different parts of the orbit as defined in Fig. 1, with INFC on the top and SUPC on the bottom, and for different inclinations i of the orbital plane, with i = 30° on the left and i = 60° on the right.
Current usage metrics show cumulative count of Article Views (full-text article views including HTML views, PDF and ePub downloads, according to the available data) and Abstracts Views on Vision4Press platform.
Data correspond to usage on the plateform after 2015. The current usage metrics is available 48-96 hours after online publication and is updated daily on week days.
Initial download of the metrics may take a while.


