Fig. 10.
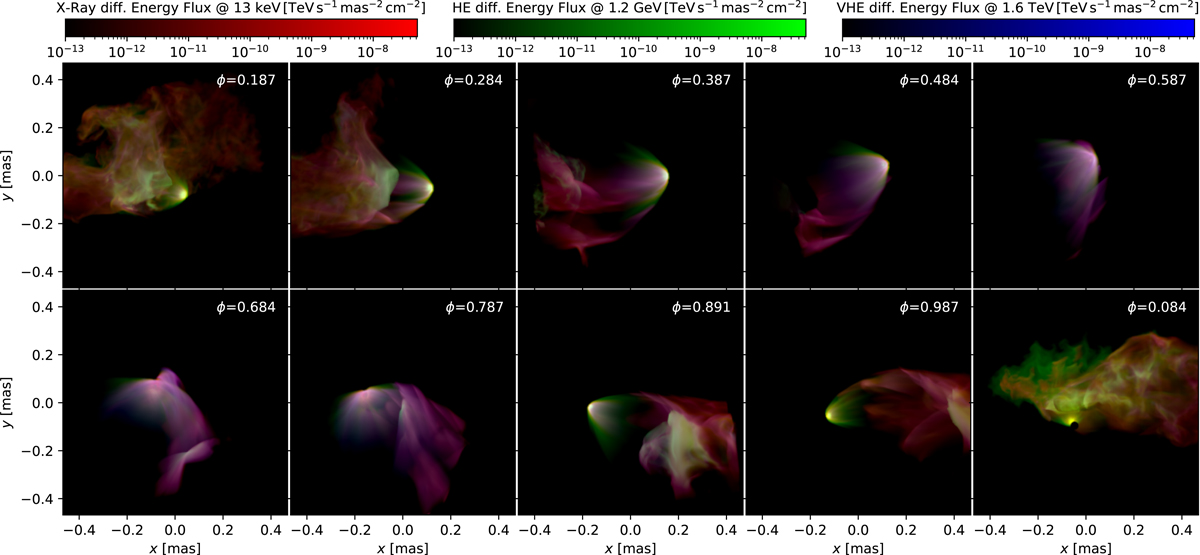
Projection of the predicted emission from LS 5039 for different orbital phases with an orbital plane inclination of i = 60°. The differential energy flux is shown for distinct energy bands as indicated by the colour bars. For better visualisation, the upper limits of the colour bars have been set two orders of magnitude lower than the maximum HE gamma-ray flux.
Current usage metrics show cumulative count of Article Views (full-text article views including HTML views, PDF and ePub downloads, according to the available data) and Abstracts Views on Vision4Press platform.
Data correspond to usage on the plateform after 2015. The current usage metrics is available 48-96 hours after online publication and is updated daily on week days.
Initial download of the metrics may take a while.