Fig. 8
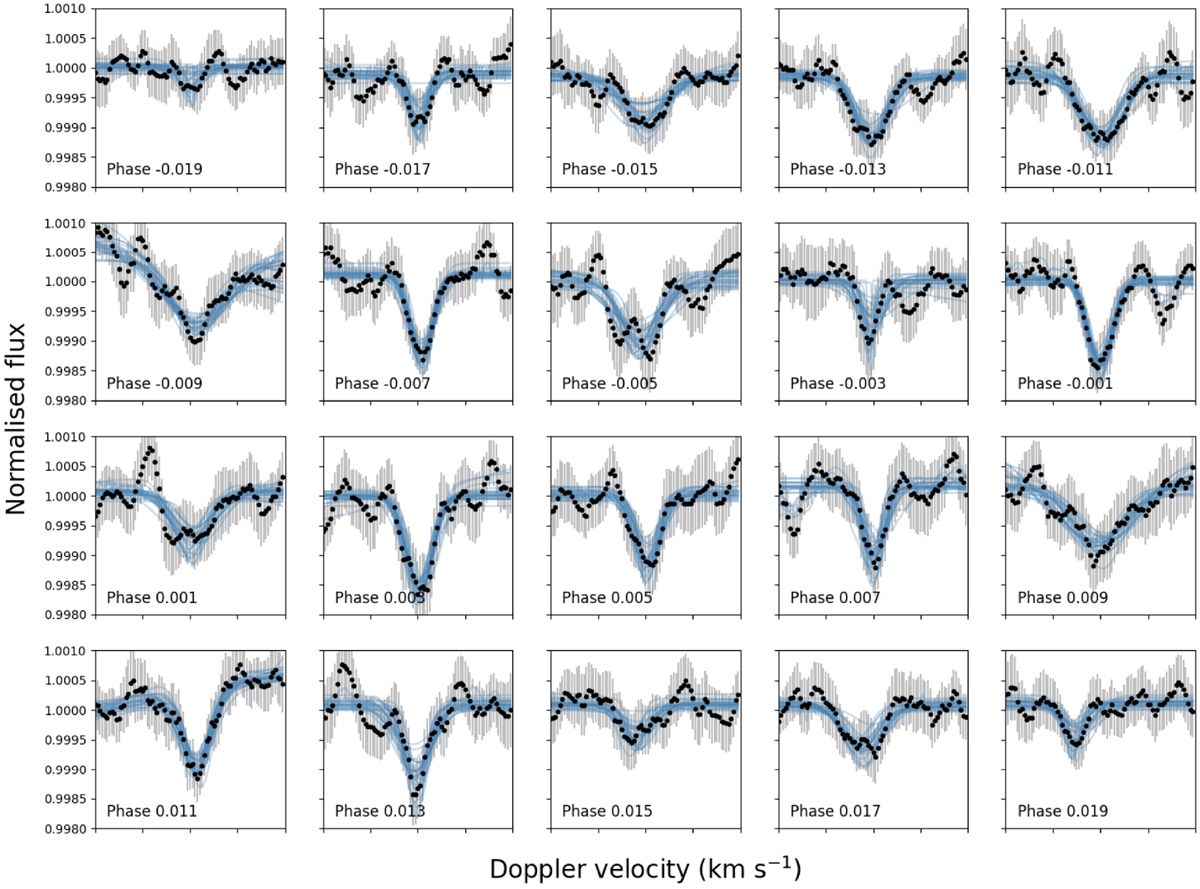
Atmospheric signal found in the line profile residuals and the relative MCMC posteriors. All the graphics have the same abscissa (RVs from −40 to 40 km s−1) and ordinate (normalised flux from 0.998 to 1.001) to better follow the evolution of the signal. The graphics extend from phase −0.019 (upper left panel) to phase 0.019 (lower right panel) with a 0.002 phase step.
Current usage metrics show cumulative count of Article Views (full-text article views including HTML views, PDF and ePub downloads, according to the available data) and Abstracts Views on Vision4Press platform.
Data correspond to usage on the plateform after 2015. The current usage metrics is available 48-96 hours after online publication and is updated daily on week days.
Initial download of the metrics may take a while.