Free Access
Fig. 5
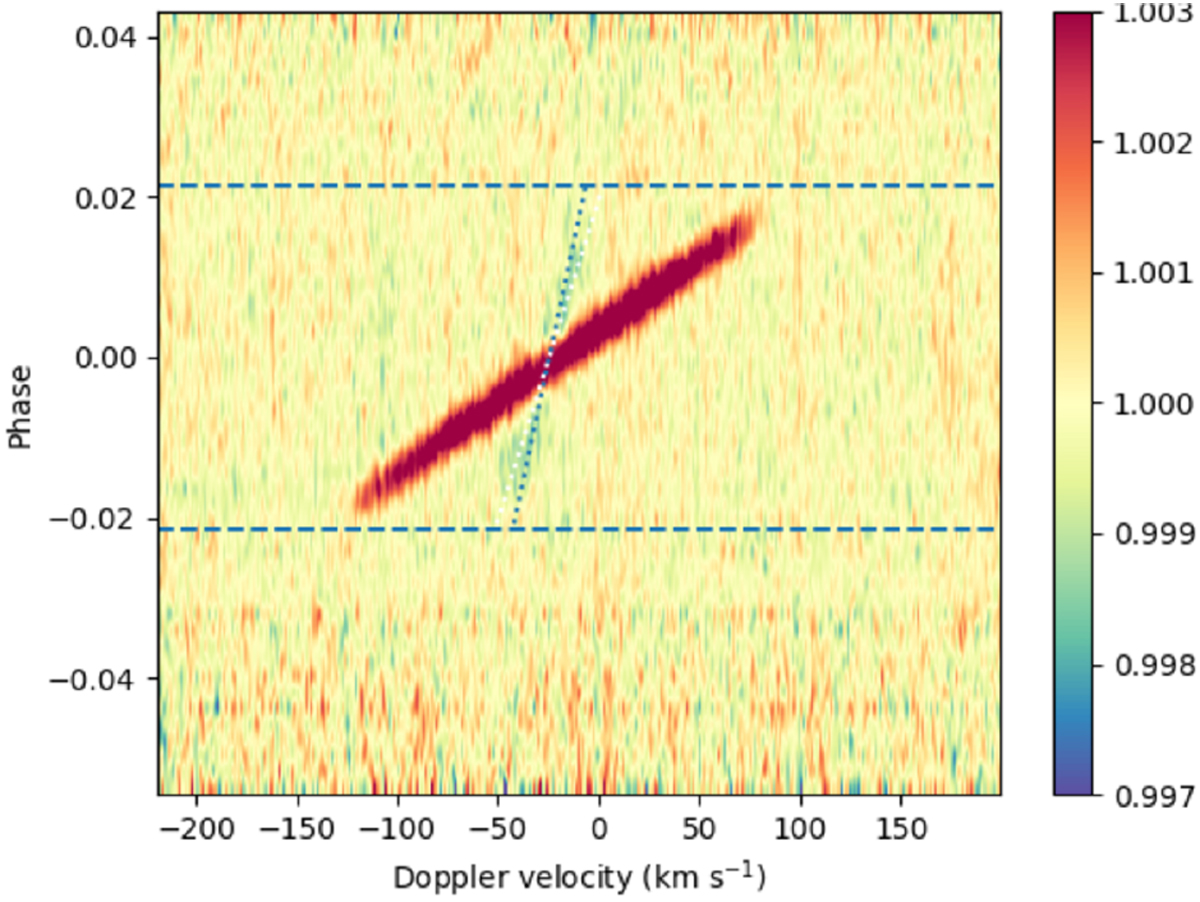
Mean line profile tomography. The average stellar line has been removed, but not the systemic velocity. The Doppler shadow (red excess) and the atmospheric trace (blue absorption, plotted by the dotted blue line) are visible in the residuals.
Current usage metrics show cumulative count of Article Views (full-text article views including HTML views, PDF and ePub downloads, according to the available data) and Abstracts Views on Vision4Press platform.
Data correspond to usage on the plateform after 2015. The current usage metrics is available 48-96 hours after online publication and is updated daily on week days.
Initial download of the metrics may take a while.