Fig. B.1
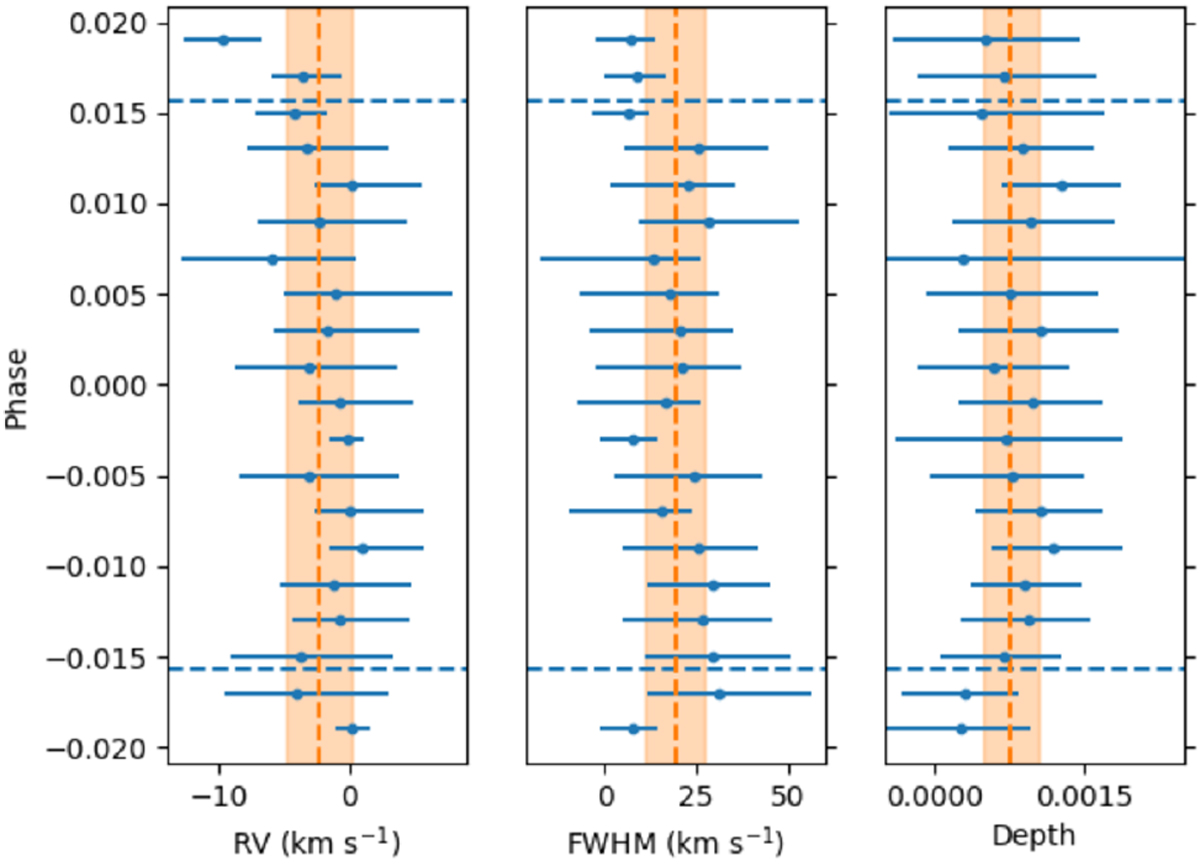
RVs, FWHM, and depth of the atmospheric signal during transit using the unfiltered data. The vertical dashed orange lines and shaded areas show the mean values and relative standard deviation for each of the three quantities. All the data lie between t0 (start of ingress) and t1 (end of egress), while the horizontal dashed blue lines indicate t2 (end of ingress) and t3 (start of egress).
Current usage metrics show cumulative count of Article Views (full-text article views including HTML views, PDF and ePub downloads, according to the available data) and Abstracts Views on Vision4Press platform.
Data correspond to usage on the plateform after 2015. The current usage metrics is available 48-96 hours after online publication and is updated daily on week days.
Initial download of the metrics may take a while.