Fig. 1
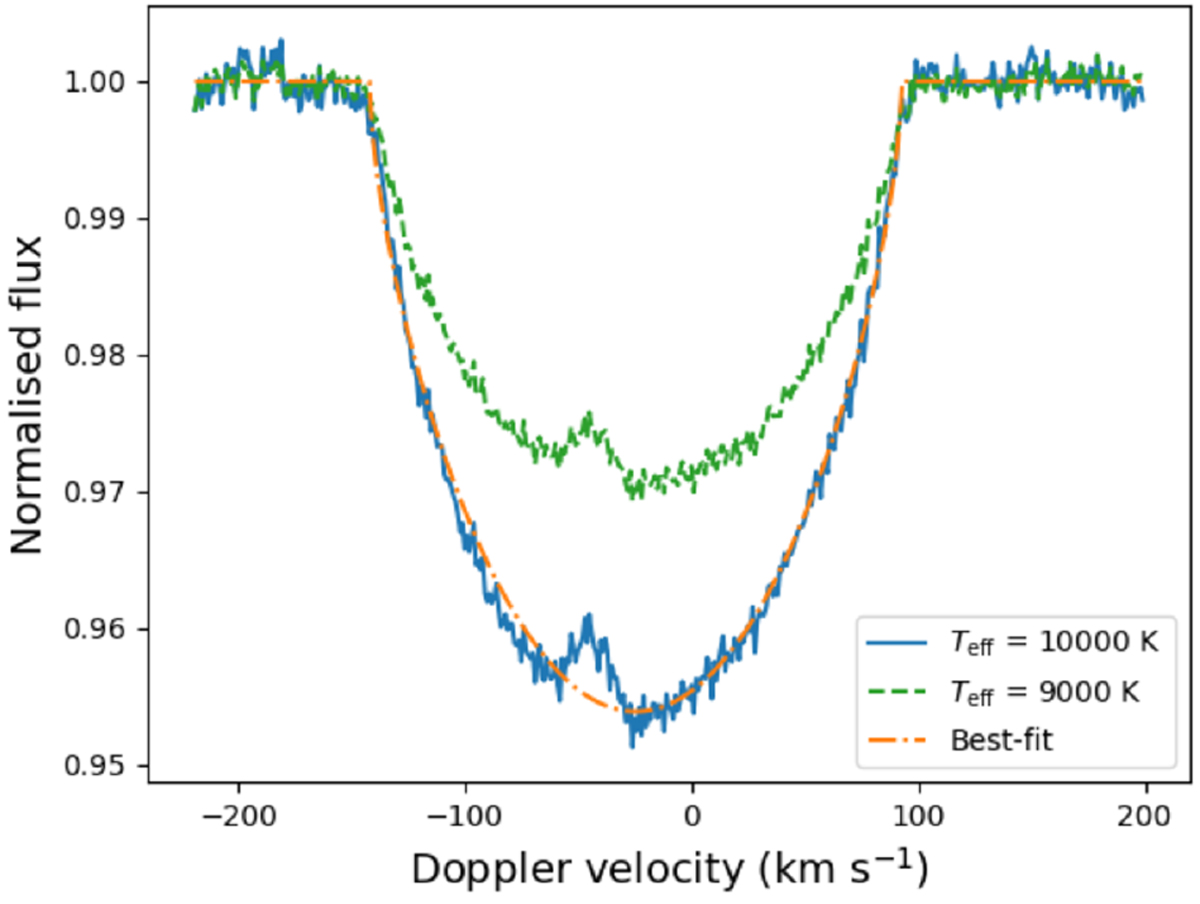
Mean line profile of a single KELT-20 spectrum obtained with the LSD software and Teff = 10 000 K (solid blue line) along with the rotational broadening fit (dash-dotted orange line). For comparison, the mean line profile of the same spectrum with the Teff = 9000 K is shown (dashed green line). The Doppler shadow of the planet is clearly visible as a bump in both lines.
Current usage metrics show cumulative count of Article Views (full-text article views including HTML views, PDF and ePub downloads, according to the available data) and Abstracts Views on Vision4Press platform.
Data correspond to usage on the plateform after 2015. The current usage metrics is available 48-96 hours after online publication and is updated daily on week days.
Initial download of the metrics may take a while.