Fig. 8.
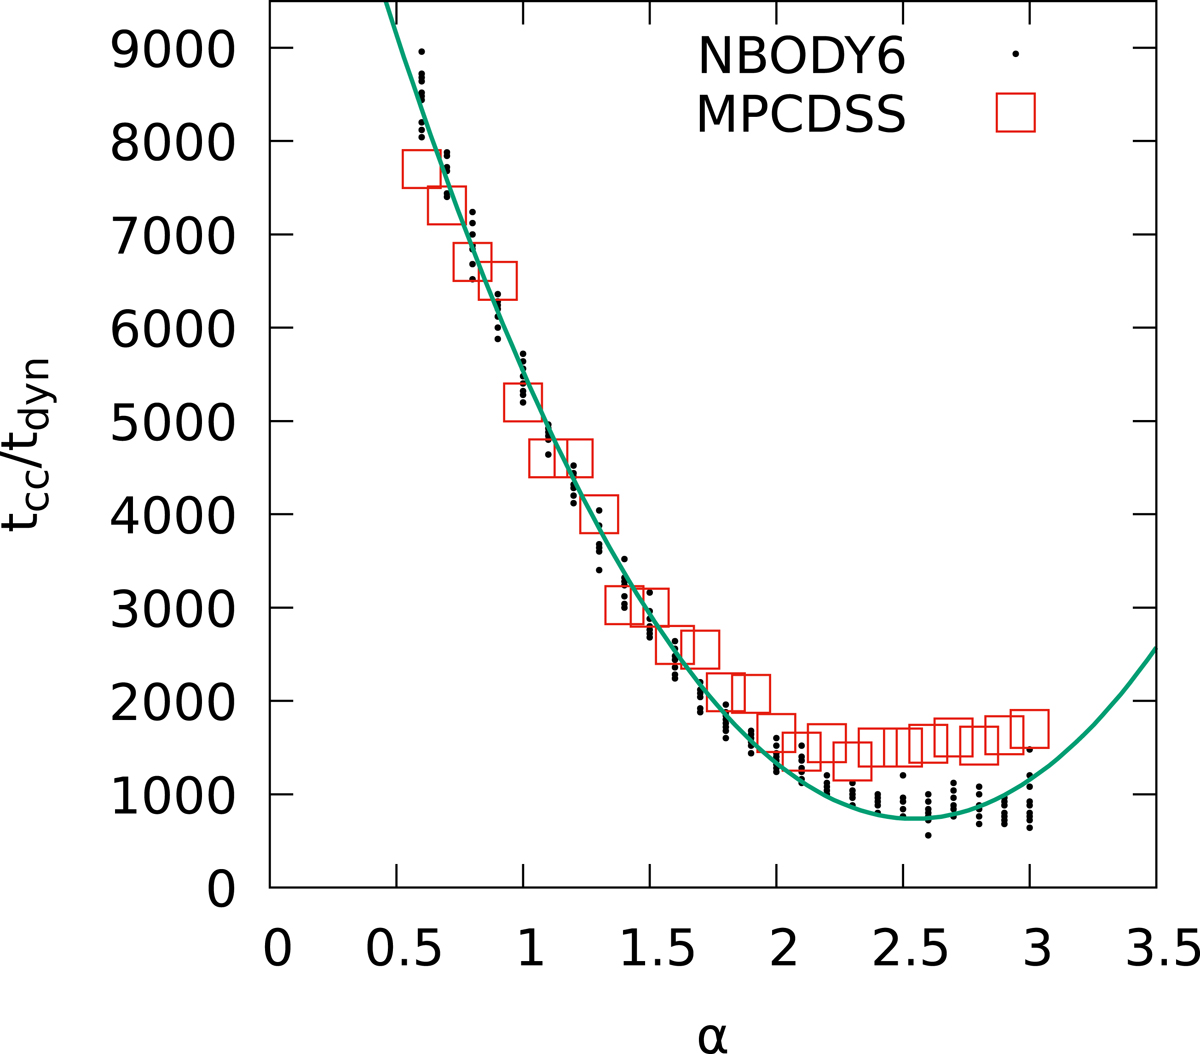
Time of core collapse tcc in units of the dynamical time tdyn as a function of the mass spectrum exponent α for MPC (empty red squares) and N-body (small black circles) simulations. A parabolic fit to the N-body simulations (thick green line) is superimposed. The MPC result is generally within the range spanned by the direct N-body realisations, except for a few values of α at the high end, where core collapse happens earlier in direct N-body simulations.
Current usage metrics show cumulative count of Article Views (full-text article views including HTML views, PDF and ePub downloads, according to the available data) and Abstracts Views on Vision4Press platform.
Data correspond to usage on the plateform after 2015. The current usage metrics is available 48-96 hours after online publication and is updated daily on week days.
Initial download of the metrics may take a while.