Free Access
Fig. 11.
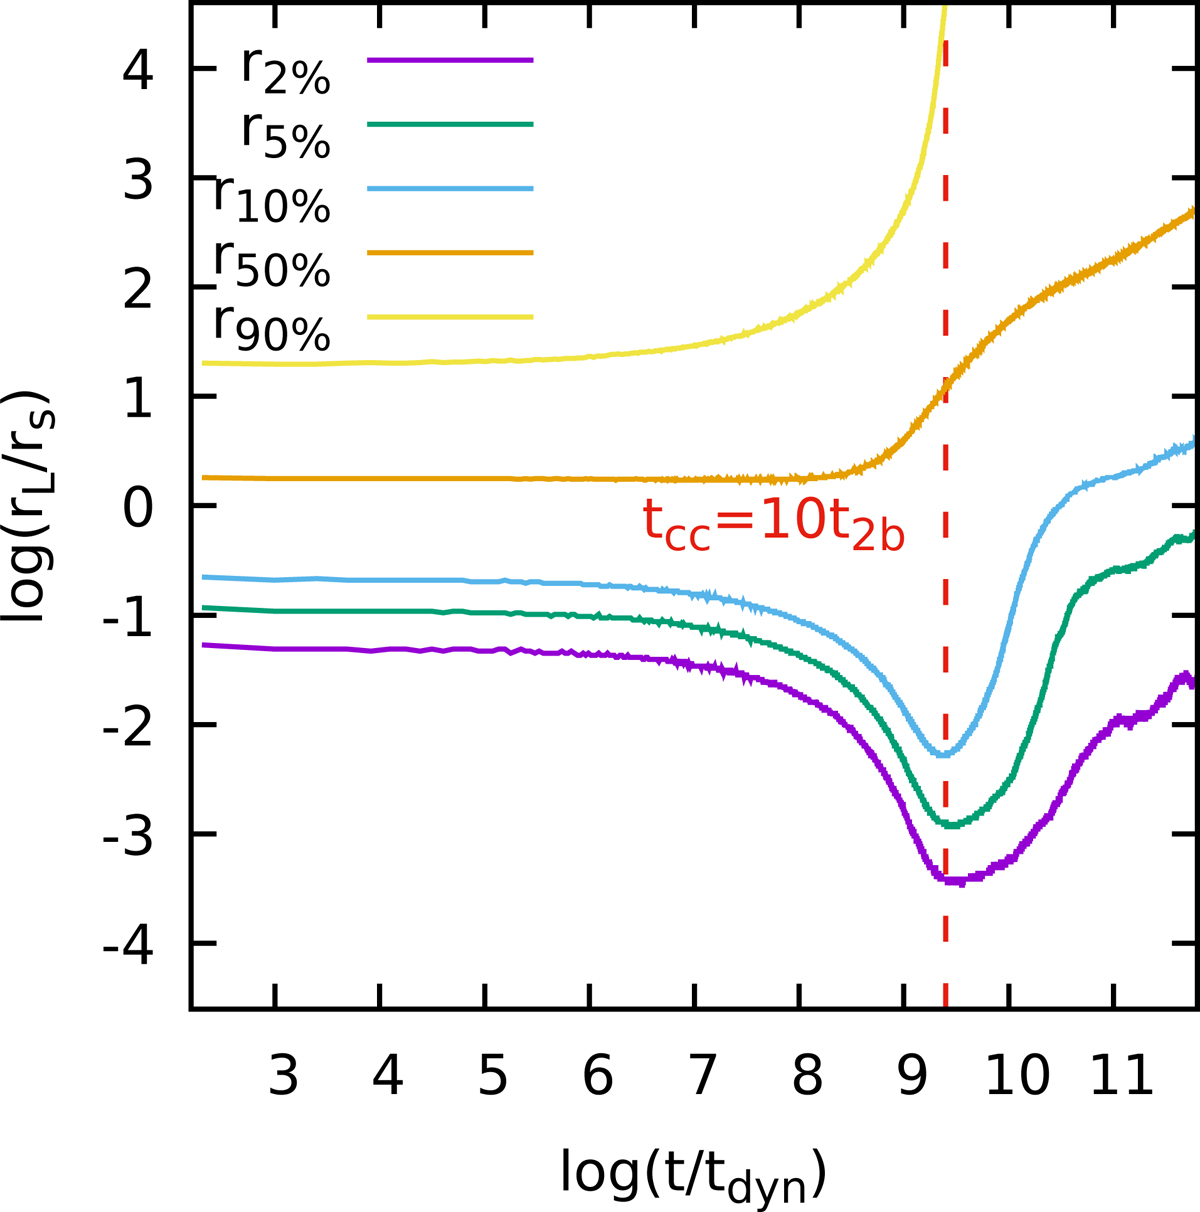
Evolution of the 3D Lagrangian radii enclosing 2%, 5%, 10%, 50%, and 90% of the total number of particles N for the same model in Fig. 10. The vertical dashed line marks the system’s core-collapse time tcc ≈ 10 t2b ≈ 12 000 tdyn.
Current usage metrics show cumulative count of Article Views (full-text article views including HTML views, PDF and ePub downloads, according to the available data) and Abstracts Views on Vision4Press platform.
Data correspond to usage on the plateform after 2015. The current usage metrics is available 48-96 hours after online publication and is updated daily on week days.
Initial download of the metrics may take a while.