Free Access
Fig. 10.
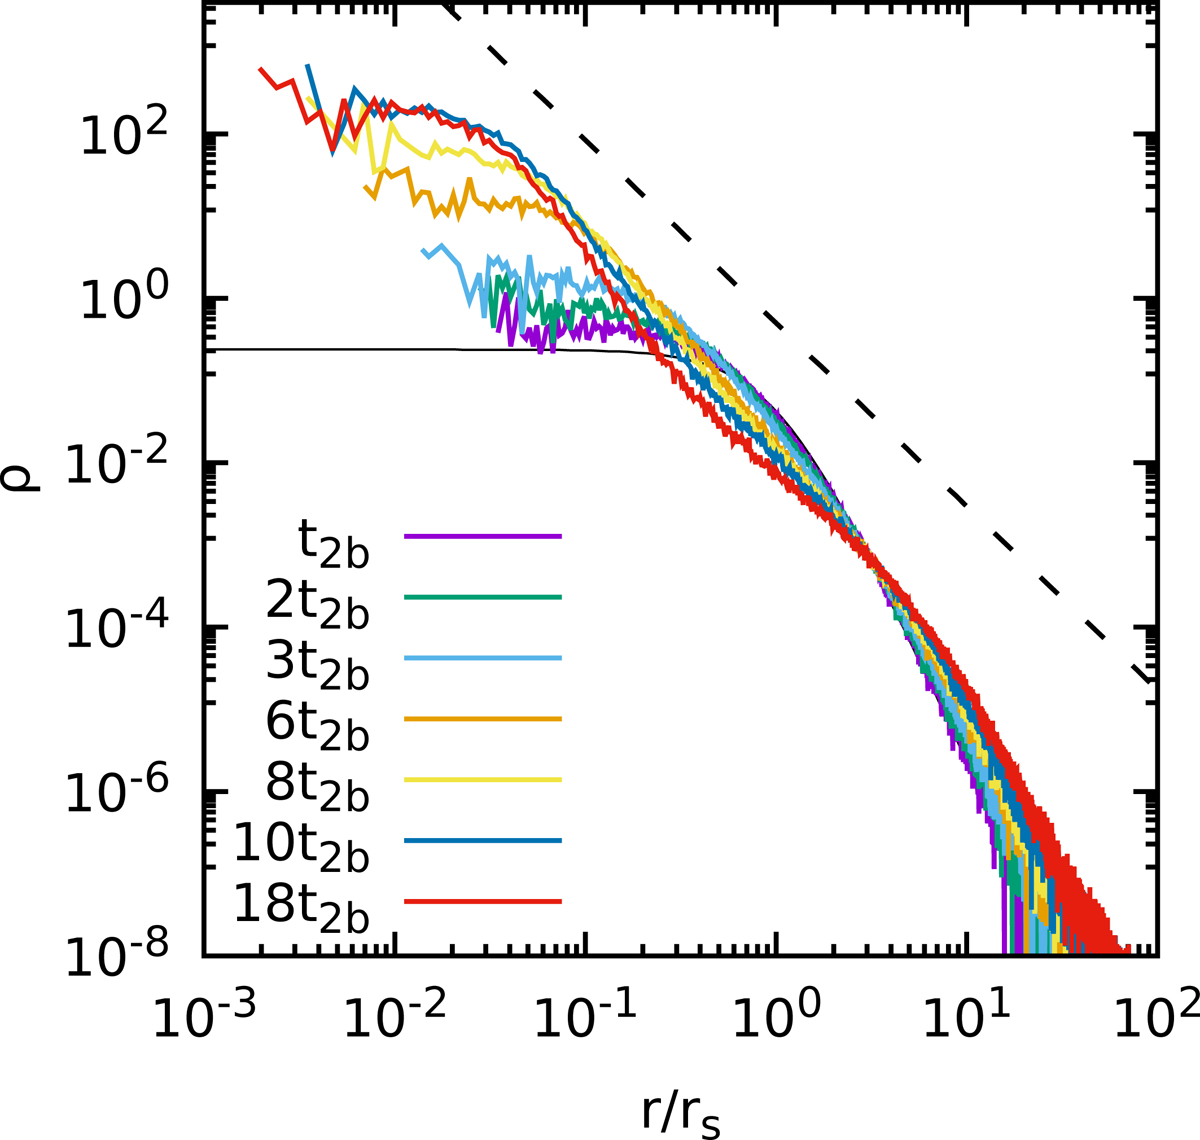
3D density profile for a model with N = 105 equal mass particles and initial Plummer density distribution (thin black solid line) at t = 1, 2, 3, 6, 8, 10, and 18 two-body relaxation times t2b (coloured lines). The heavy dashed line marks the theoretical r−2.23 profile.
Current usage metrics show cumulative count of Article Views (full-text article views including HTML views, PDF and ePub downloads, according to the available data) and Abstracts Views on Vision4Press platform.
Data correspond to usage on the plateform after 2015. The current usage metrics is available 48-96 hours after online publication and is updated daily on week days.
Initial download of the metrics may take a while.