Fig. 1.
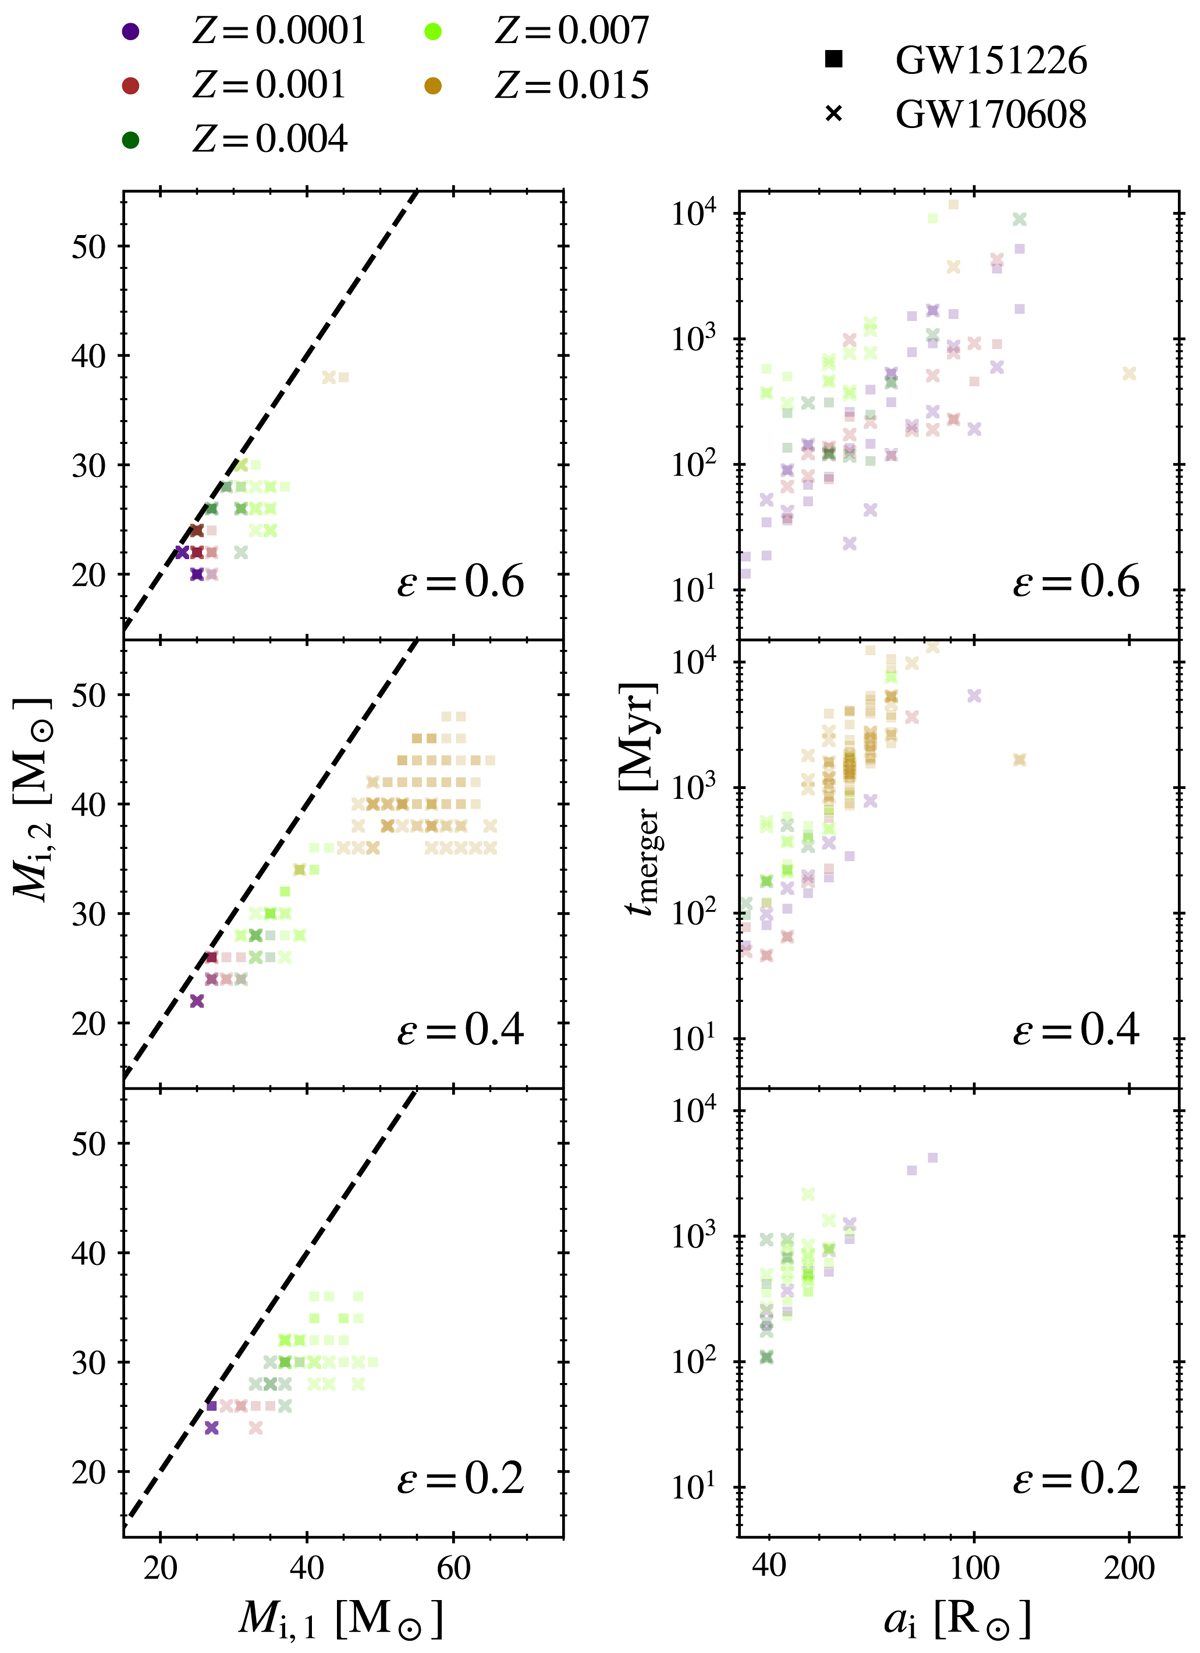
Target regions of the parameter space for GW151226 (square markers) and GW170608 (cross markers) for models with αCE = 2.0. Left panels: progenitor initial masses (Mi, 1 > Mi, 2). Right panels: merger time delay (tmerge) against initial binary separation (ai). Panels from top to bottom correspond to each set of efficiencies: ϵ = 0.6, 0.4, 0.2. Dashed lines indicate equal progenitor masses.
Current usage metrics show cumulative count of Article Views (full-text article views including HTML views, PDF and ePub downloads, according to the available data) and Abstracts Views on Vision4Press platform.
Data correspond to usage on the plateform after 2015. The current usage metrics is available 48-96 hours after online publication and is updated daily on week days.
Initial download of the metrics may take a while.