Fig. 9.
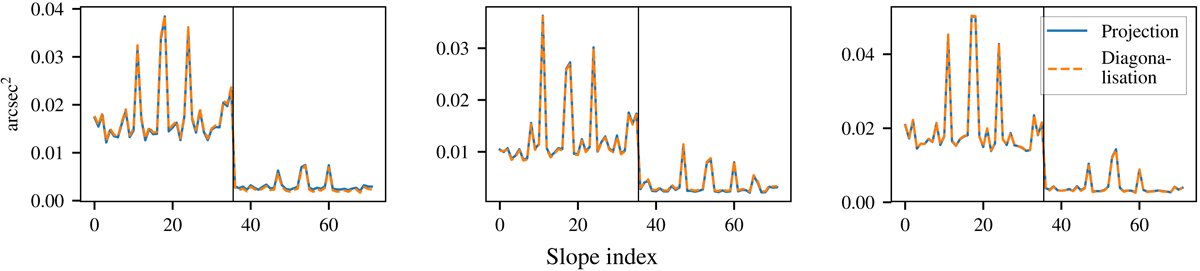
Noise measured on the LS for each slope along the elongated axis (first 36 slopes) and the thin axis (last 36 slopes) for one acquisition in sequences 5, 10, and 15 (left to right). The blue curves show the noise values obtained when projecting the slopes on the elongated and thin axes of the spot, the orange dashed curves show the values obtained when computing the eigenvalues of the covariance matrix ![]() .
.
Current usage metrics show cumulative count of Article Views (full-text article views including HTML views, PDF and ePub downloads, according to the available data) and Abstracts Views on Vision4Press platform.
Data correspond to usage on the plateform after 2015. The current usage metrics is available 48-96 hours after online publication and is updated daily on week days.
Initial download of the metrics may take a while.