Open Access
Fig. 8.
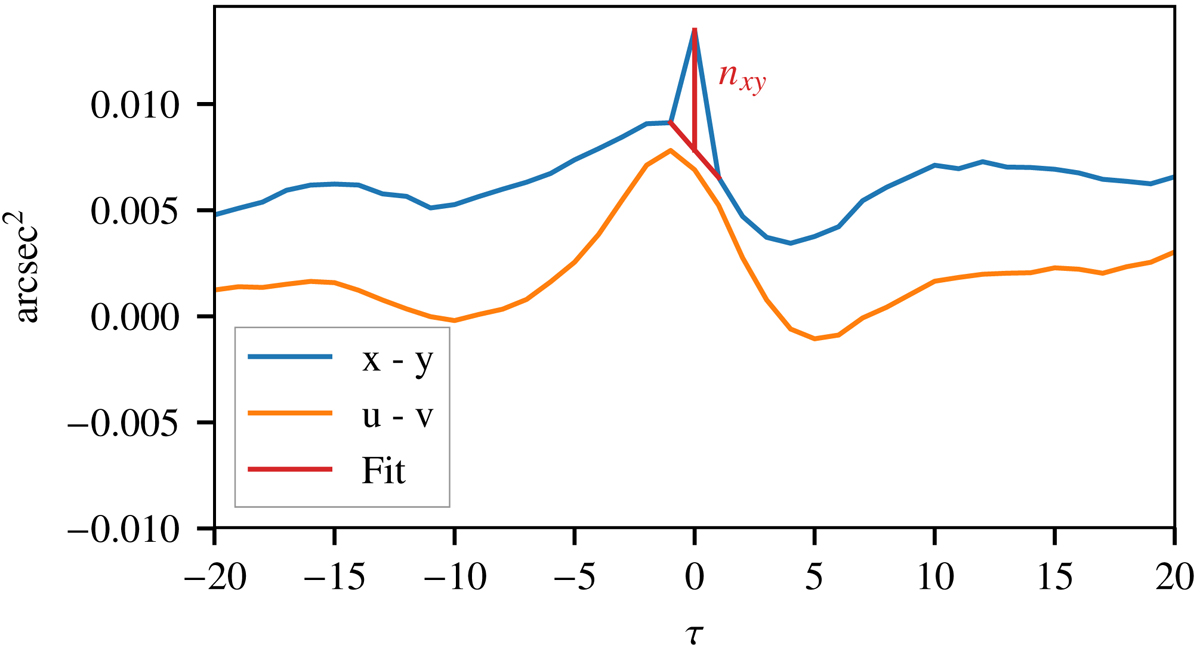
Demonstration of the fitting of the Dirac (in red) on the cross-correlation of slopes along the x- and y-axis of a subaperture (blue line) and the absence of Dirac on the cross-correlation of slopes projected on the elonged and non-elongated axes of the spots (orange line).
Current usage metrics show cumulative count of Article Views (full-text article views including HTML views, PDF and ePub downloads, according to the available data) and Abstracts Views on Vision4Press platform.
Data correspond to usage on the plateform after 2015. The current usage metrics is available 48-96 hours after online publication and is updated daily on week days.
Initial download of the metrics may take a while.