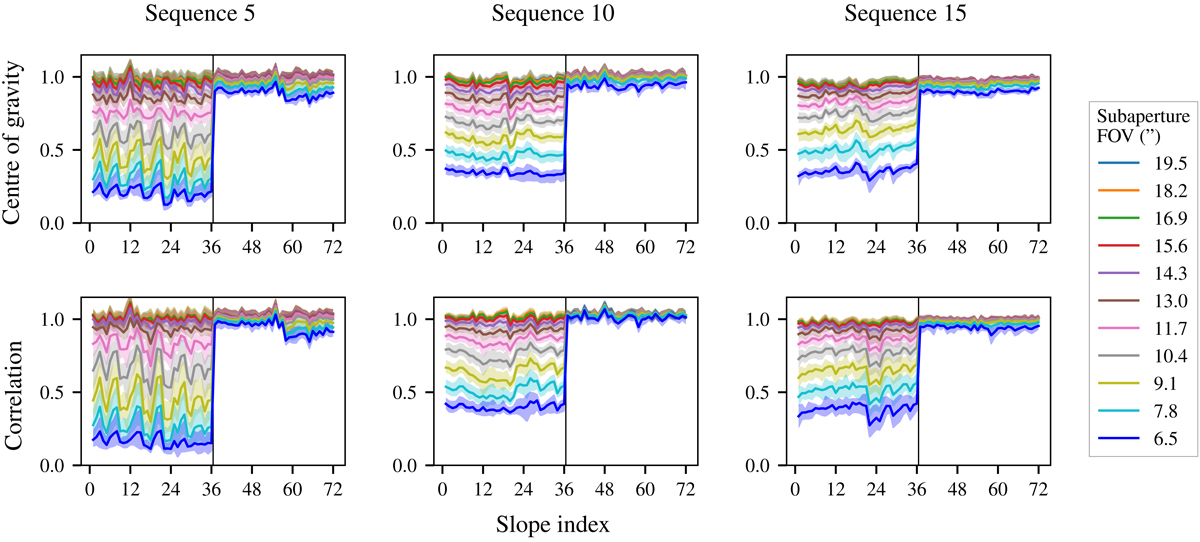
Fig. 6.

Centroid gain per slope for centre of gravity (top row) and correlation (bottom row) for sequence 5 (first column), 10 (second column), and 15 (third column) as the subaperture field of view is reduced. The first 36 points (left of the vertical solid line) in abscissae show the centroid gains for the slopes along the elongation axis; the remaining points (right of the vertical solid line) are the centroid gain along the minor axes of the spots. The solid coloured lines represent the mean value found across the different dithering acquisitions of a sequence, while the shaded areas show the full dispersions of the values found across the same sequence.
Current usage metrics show cumulative count of Article Views (full-text article views including HTML views, PDF and ePub downloads, according to the available data) and Abstracts Views on Vision4Press platform.
Data correspond to usage on the plateform after 2015. The current usage metrics is available 48-96 hours after online publication and is updated daily on week days.
Initial download of the metrics may take a while.


