Fig. 5.
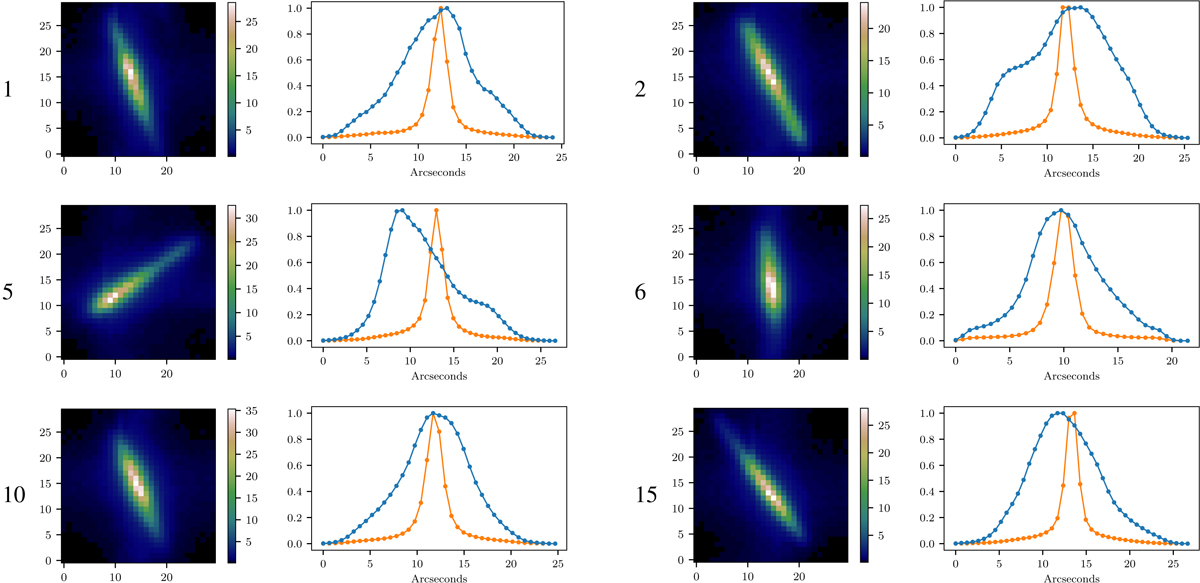
Spot examples, the corresponding sequence number is given in the titles, and the corresponding profiles along the elongated (blue) and the thin (orange) axis. Images are averaged over 500 frames. Their intensities are in photoelectron, whereas the 1D profiles have been normalised. One example has been taken per set of temporally continuous sequences.
Current usage metrics show cumulative count of Article Views (full-text article views including HTML views, PDF and ePub downloads, according to the available data) and Abstracts Views on Vision4Press platform.
Data correspond to usage on the plateform after 2015. The current usage metrics is available 48-96 hours after online publication and is updated daily on week days.
Initial download of the metrics may take a while.