Fig. 15.
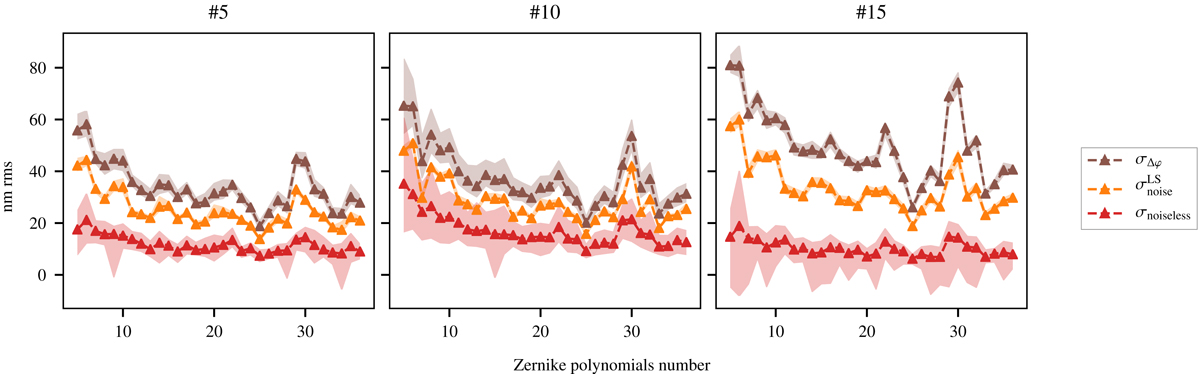
Decomposition of the dynamic terms along the first 36 Zernike polynomials for the three example sequences. The points represent the average value across one sequence; the shaded areas represent the peak to valley dispersion of the values measured in the course of a sequence. Only the results found using correlation are plotted; the curves using centre of gravity follow the same pattern.
Current usage metrics show cumulative count of Article Views (full-text article views including HTML views, PDF and ePub downloads, according to the available data) and Abstracts Views on Vision4Press platform.
Data correspond to usage on the plateform after 2015. The current usage metrics is available 48-96 hours after online publication and is updated daily on week days.
Initial download of the metrics may take a while.