Fig. 13.
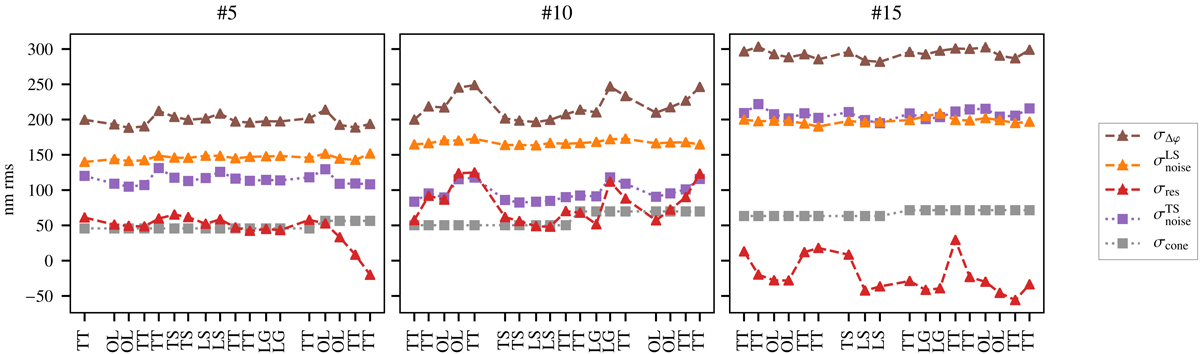
Dynamic terms of the error breakdown across time for three sequences. The labels along the x-axis correspond to the loop configuration: TT represents a dithering acquisition, TS means that the loop was driven by the TS, LS means that the loop was driven by the LS, LG means that the loop was driven by the TS with low gains, and OL means that the loop was open. Only the results found using correlation are plotted as the curves using centre of gravity follow the same pattern.
Current usage metrics show cumulative count of Article Views (full-text article views including HTML views, PDF and ePub downloads, according to the available data) and Abstracts Views on Vision4Press platform.
Data correspond to usage on the plateform after 2015. The current usage metrics is available 48-96 hours after online publication and is updated daily on week days.
Initial download of the metrics may take a while.