Fig. 3
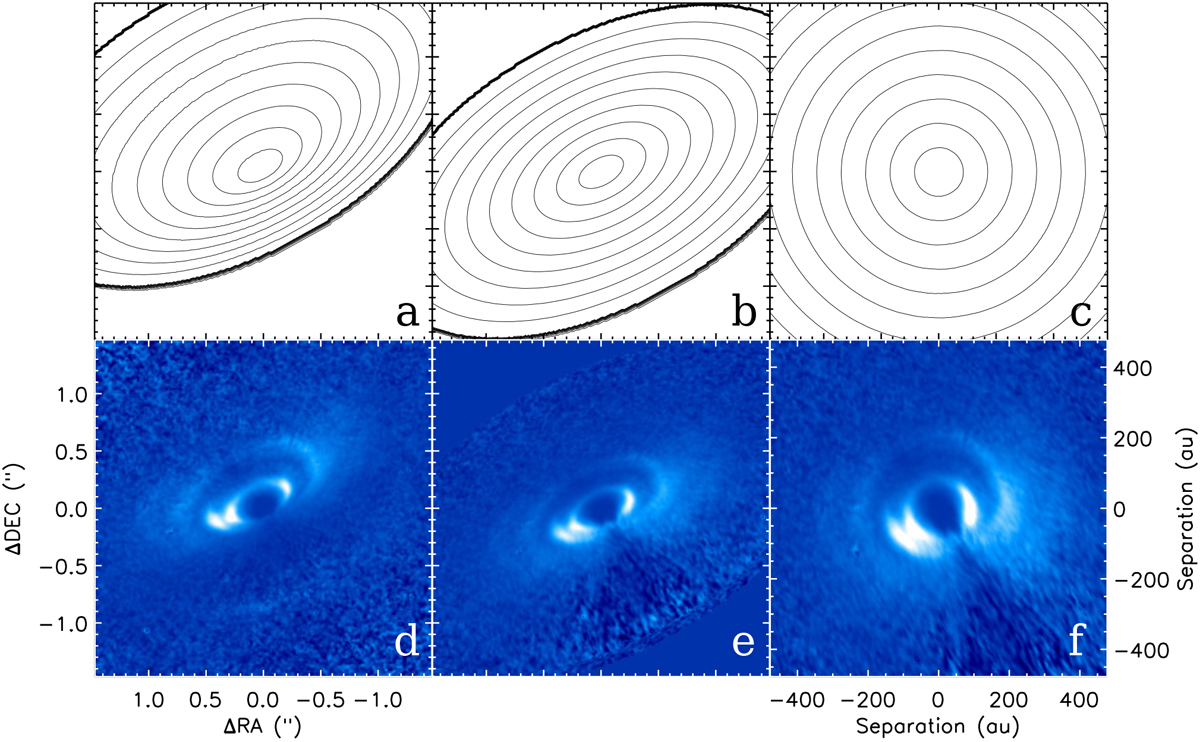
(a): map of the height profile using the function H scat (r) = 0.29r. (b): height map shifted with Hscat × sin i in the direction of the minor axis to create concentric ellipses. (c): the centered height map of panel b is stretched along the minor axis with 1∕ cos i. (d): original inclination corrected r2 scaled Qphi image (as Fig. 1)c. (e): ophi image shifted in the same way as the height map in panel b. This step creates a “flattened” but inclined image. (f): stretched following the deprojection of panel c, to show the disk similar to a face-on orientation.
Current usage metrics show cumulative count of Article Views (full-text article views including HTML views, PDF and ePub downloads, according to the available data) and Abstracts Views on Vision4Press platform.
Data correspond to usage on the plateform after 2015. The current usage metrics is available 48-96 hours after online publication and is updated daily on week days.
Initial download of the metrics may take a while.