Fig. 2
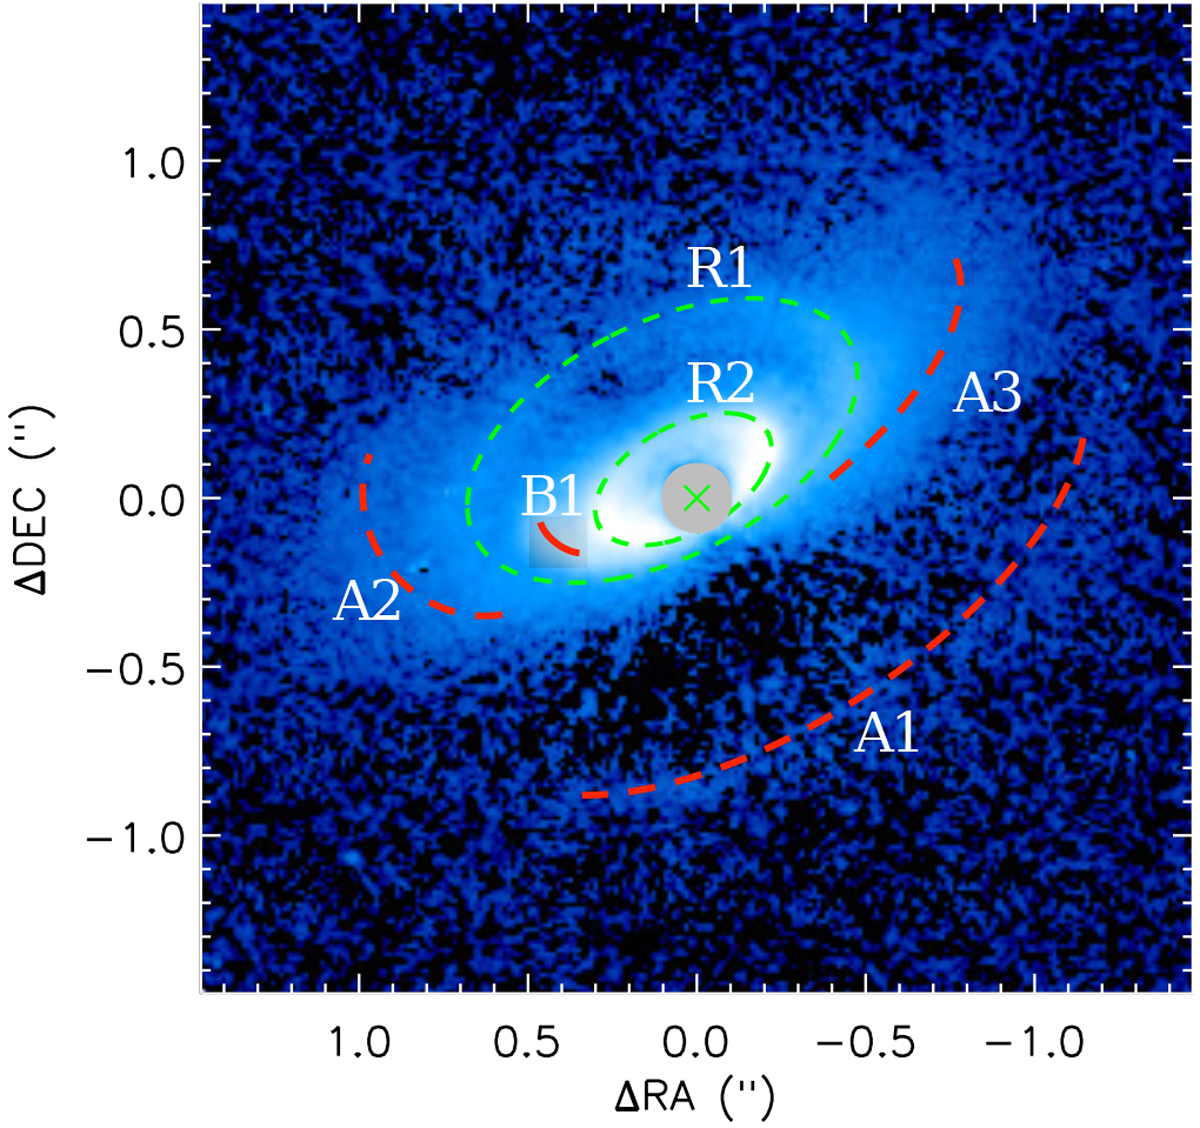
Same image as Fig. 1a, but shown in logarithmic scale and overlaid with arcs and with the most prominent disk features highlighted. Two possible rings (R1 and R2, green dashed ellipses), three arcs (A1, A2 and A3, red dashed arc) and a small arc or blob in between the two rings (B1, red solid arc) are distinguished. While the red arcs only highlight the features mentioned above, the green dashed ellipses show the best fits for R1 and R2 with the fit parameters listed in Table 1. The gray circle at the location of the star shows the size of the coronagraph inner working angle.
Current usage metrics show cumulative count of Article Views (full-text article views including HTML views, PDF and ePub downloads, according to the available data) and Abstracts Views on Vision4Press platform.
Data correspond to usage on the plateform after 2015. The current usage metrics is available 48-96 hours after online publication and is updated daily on week days.
Initial download of the metrics may take a while.