Free Access
Fig. 4.
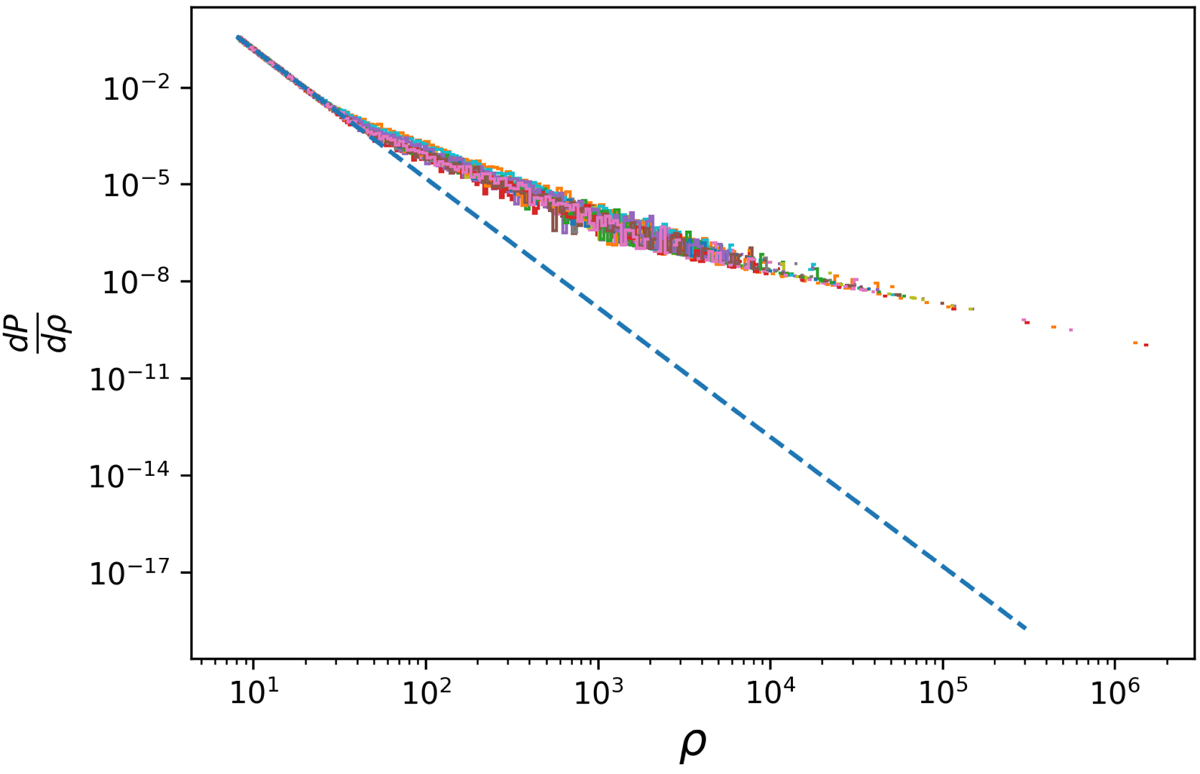
Normalised S/N distribution. The dashed line represents the theoretical curve, with ρmin = 8. Other curves are the distributions of 16 simulated models (listed in Sect. 7.1) based on 105 binaries.
Current usage metrics show cumulative count of Article Views (full-text article views including HTML views, PDF and ePub downloads, according to the available data) and Abstracts Views on Vision4Press platform.
Data correspond to usage on the plateform after 2015. The current usage metrics is available 48-96 hours after online publication and is updated daily on week days.
Initial download of the metrics may take a while.