Fig. 6.
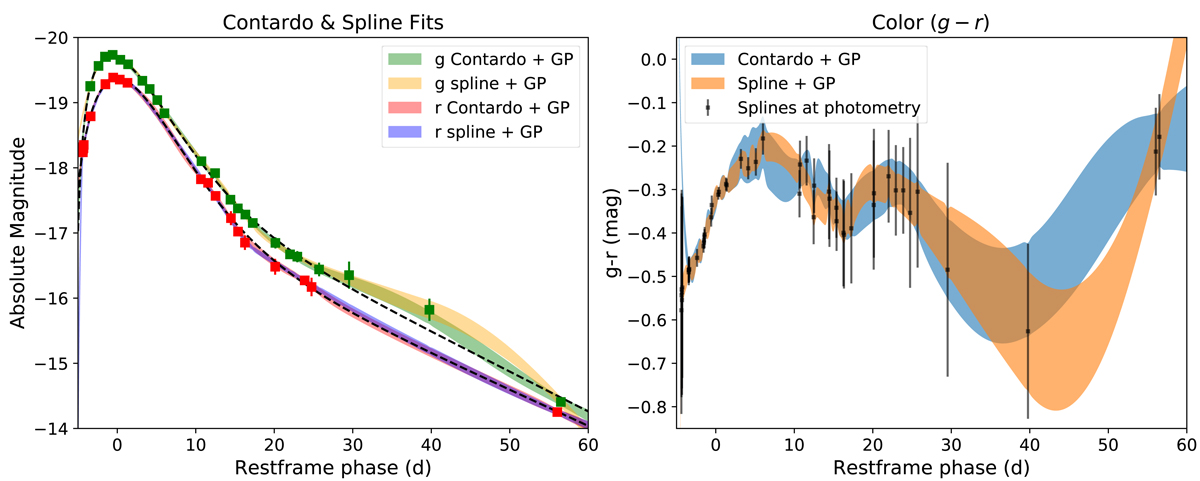
Left: empirical fits to g and r-band LCs used for interpolation. The LCs were fit with both a purely empirical Contardo et al. (2000) model and with smoothing splines. Both these models were modified by a Gaussian process that allowed for both random noise and smooth deviations from the fits. The resulting models were used for interpolation. Right: restframe g − r color evolution of SN 2018bcc using the interpolations from the left panel. Both methods produced similar results. The black data points represent spline interpolation of the g and r bands to each other at the epochs of photometry with a linear interpolation of the photometric error added in quadrature.
Current usage metrics show cumulative count of Article Views (full-text article views including HTML views, PDF and ePub downloads, according to the available data) and Abstracts Views on Vision4Press platform.
Data correspond to usage on the plateform after 2015. The current usage metrics is available 48-96 hours after online publication and is updated daily on week days.
Initial download of the metrics may take a while.