Fig. 4.
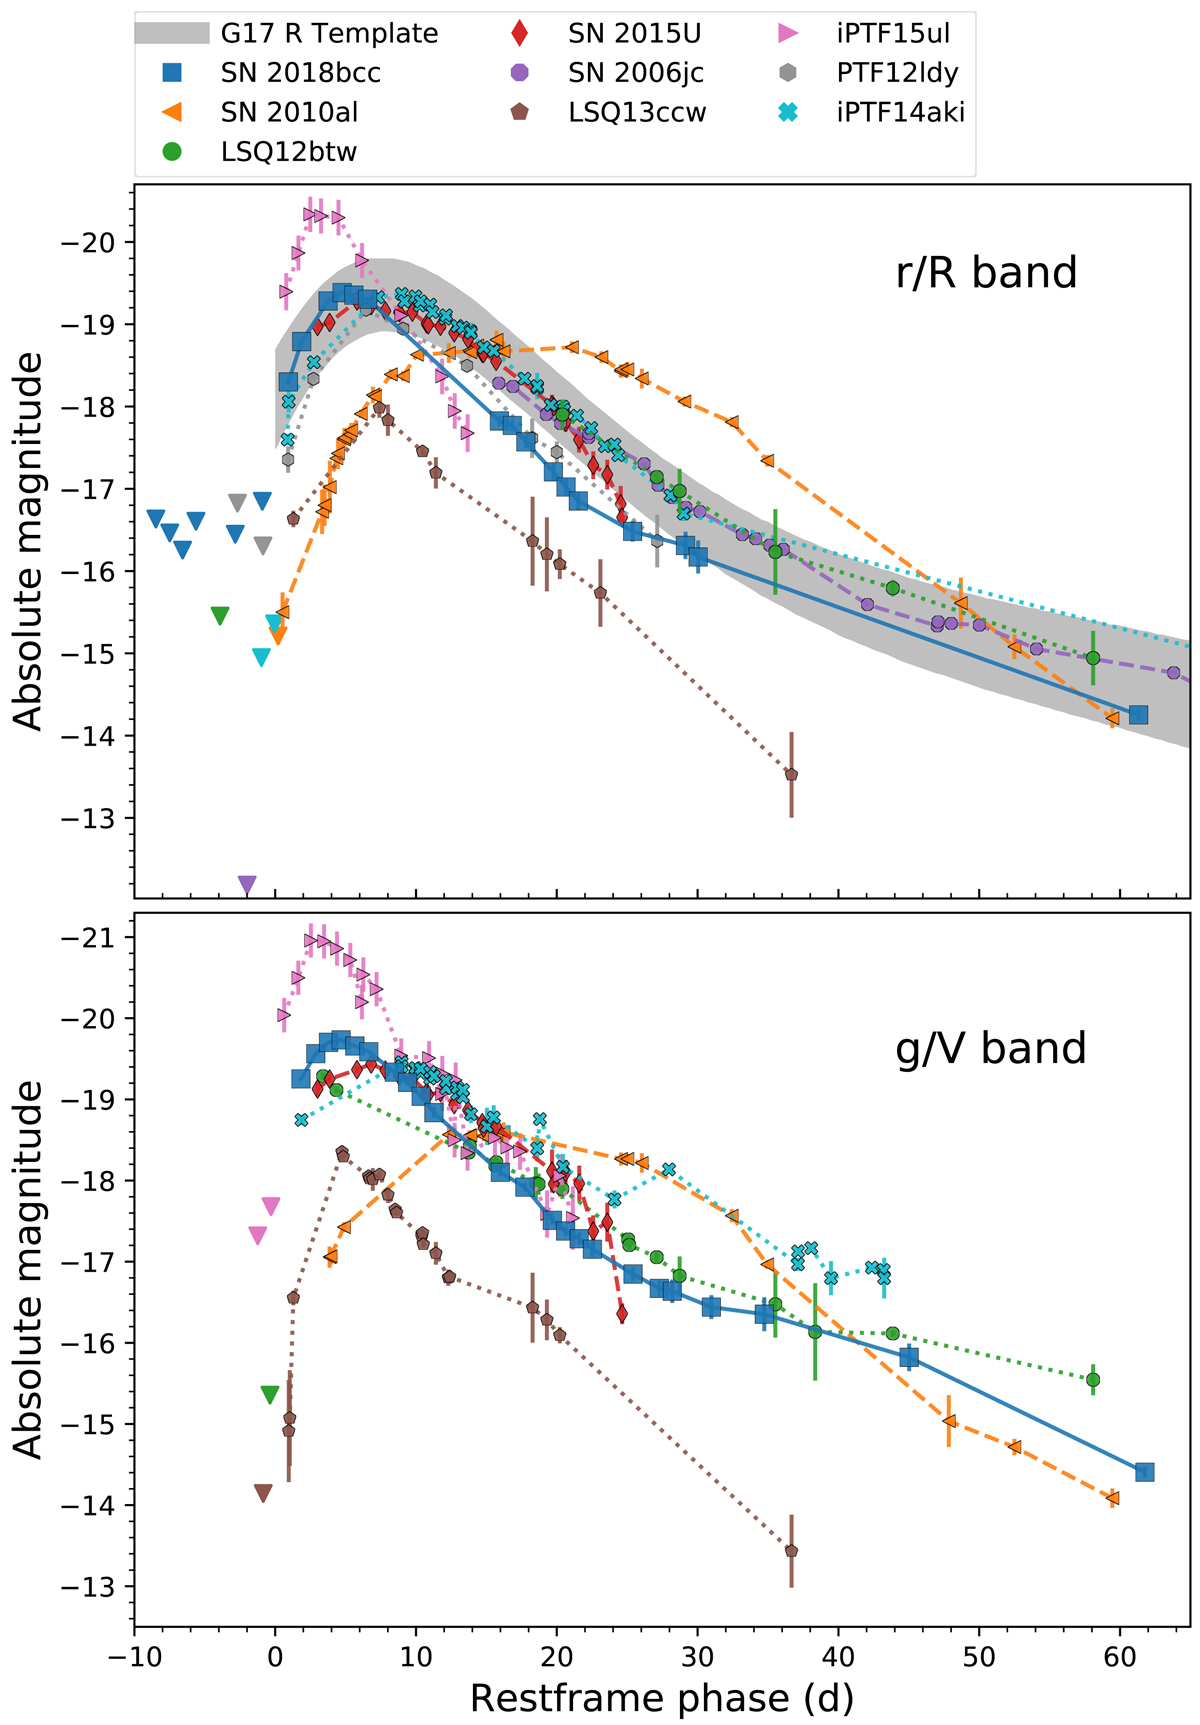
Restframe absolute magnitude LC of SN 2018bbc (binned daily) compared to the literature sample (Sect. 4). SN 2018bbc is shown with a blue line, the fast-rising SNe sare shown with dotted lines, and the other Type Ibn SN LCs are shown with dashed lines. Upper panel: r/R band while lower panel: g/V-band LCs. The LCs are plotted relative to estimated explosion epoch and their respective pre-discovery limits are also shown with triangles. They have been corrected for redshift, MW, and host extinction (where appropriate). The R-band Type Ibn template from Hosseinzadeh et al. (2017) is plotted for comparison, with the phase given since the first available template point.
Current usage metrics show cumulative count of Article Views (full-text article views including HTML views, PDF and ePub downloads, according to the available data) and Abstracts Views on Vision4Press platform.
Data correspond to usage on the plateform after 2015. The current usage metrics is available 48-96 hours after online publication and is updated daily on week days.
Initial download of the metrics may take a while.