Fig. A.1.
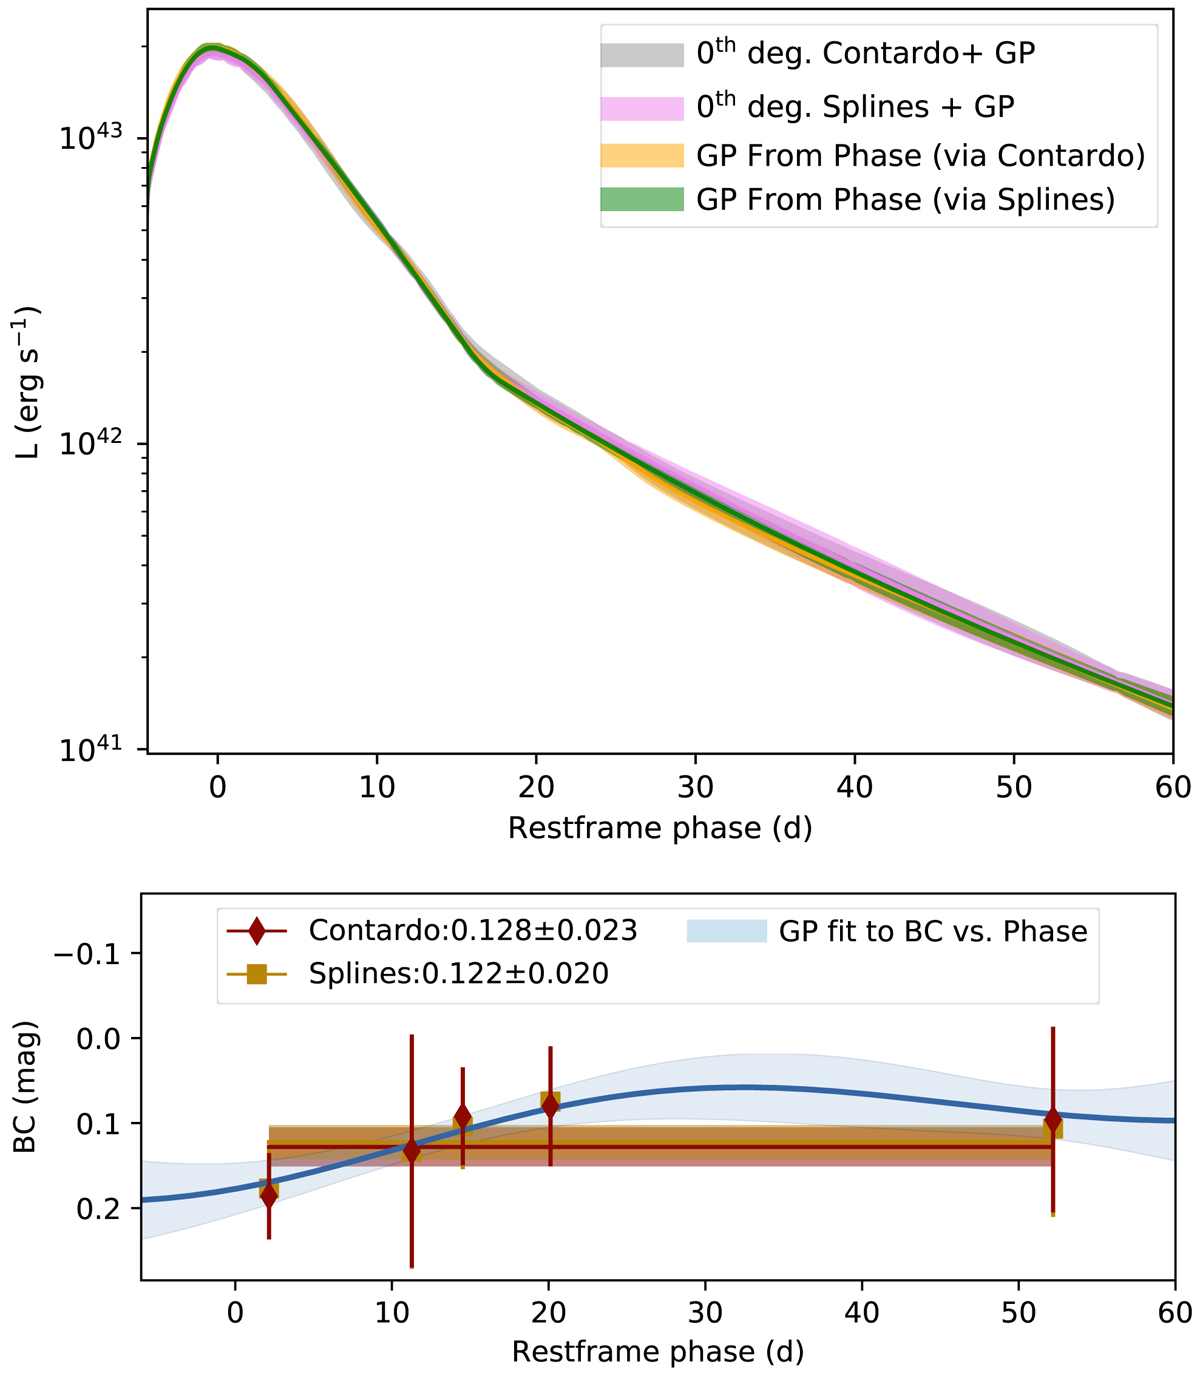
Top: bolometric LC of SN 2018bcc. Results from methods discussed in Sect. 6.1 are plotted with different colors and agree within the uncertainties. Bottom: fits to the bolometric correction (BC) as a function of phase, obtained via methods discussed in Sect. 6.1 and Appendix A. Resulting bolometric LCs from these methods are plotted in the top panel.
Current usage metrics show cumulative count of Article Views (full-text article views including HTML views, PDF and ePub downloads, according to the available data) and Abstracts Views on Vision4Press platform.
Data correspond to usage on the plateform after 2015. The current usage metrics is available 48-96 hours after online publication and is updated daily on week days.
Initial download of the metrics may take a while.