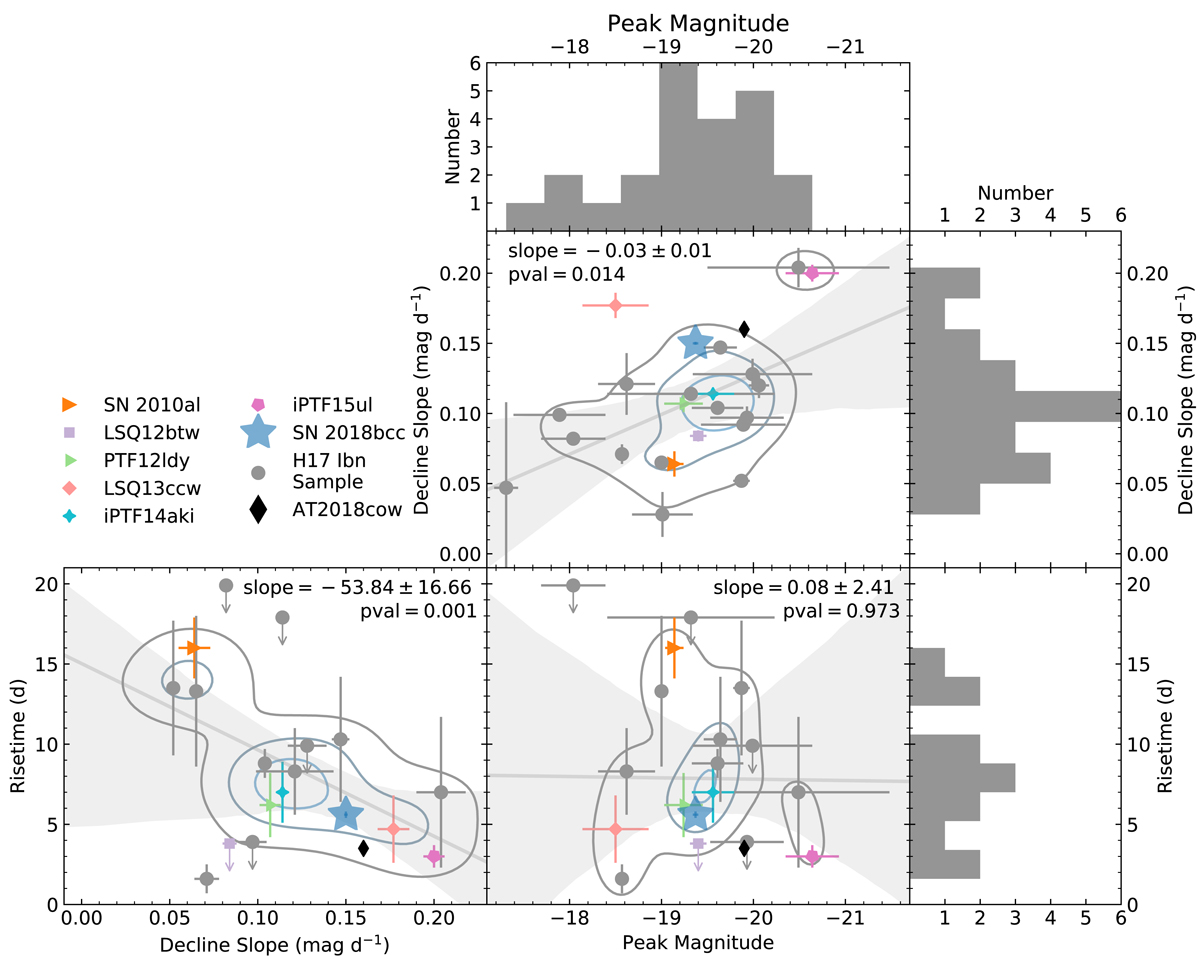
Fig. 14.

Comparison of observational properties of SN 2018bcc with the literature sample of Type Ibn SNe from H17, adapted from their Fig. 12. SN 2018bcc (blue star) and the comparison sample used in this paper are indicated against the rest (gray circles). The results of an unweighted linear regression are shown in gray lines with the given slope and p-value, with the 90% confidence intervals indicated by the shaded regions. A density estimate is overplotted for each scatter plot using contours. Based on these results, SN 2018bcc seems to be a typical member of the fast-evolving subtype. The linear regression uncertainties are calculated from the scatter in the data, ignoring the individual errors. The rise time upper limits are not included in the linear regression, density estimates, or the histogram.
Current usage metrics show cumulative count of Article Views (full-text article views including HTML views, PDF and ePub downloads, according to the available data) and Abstracts Views on Vision4Press platform.
Data correspond to usage on the plateform after 2015. The current usage metrics is available 48-96 hours after online publication and is updated daily on week days.
Initial download of the metrics may take a while.


