Fig. 1.
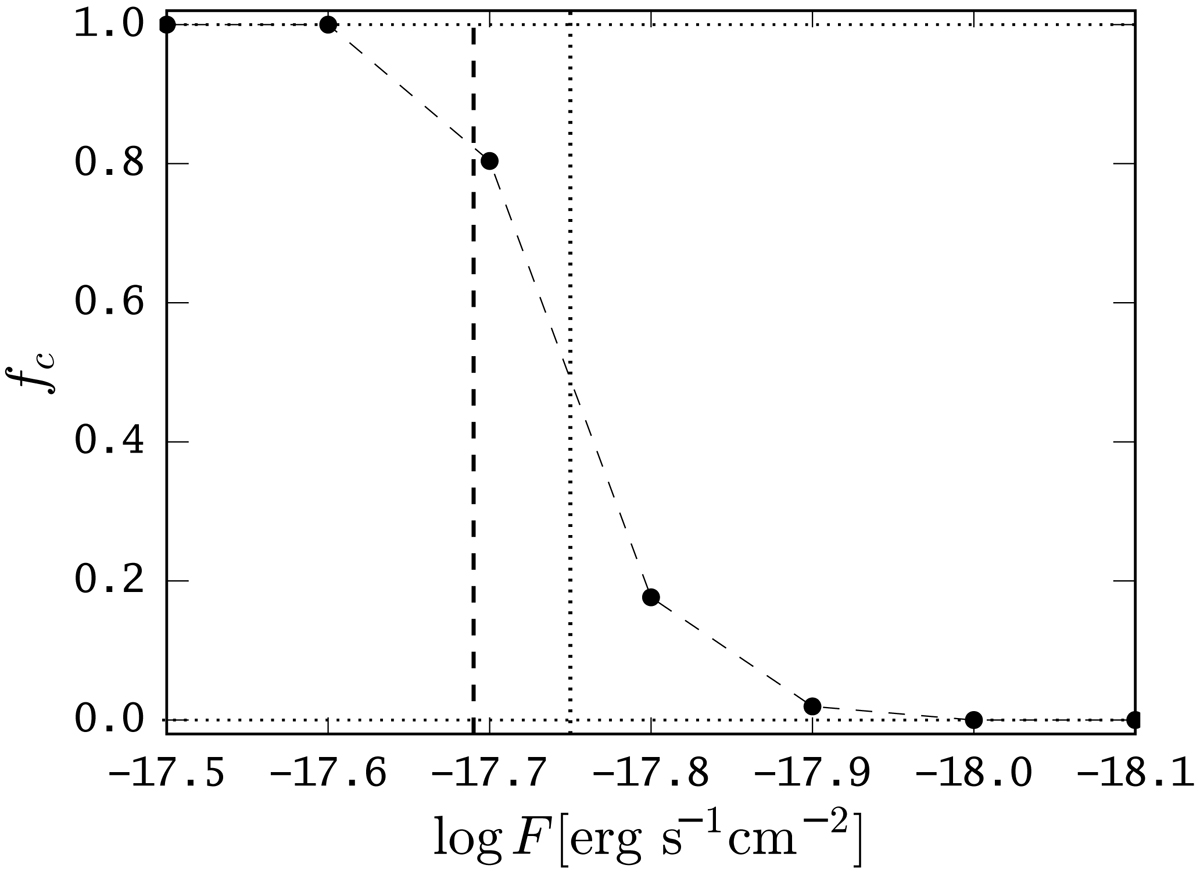
Completeness curve fC(log F [erg s−1 cm−2 Å−1]) from a fake source insertion and recovery experiment on the MUSE HDF-S datacube at 5000 Å. The dotted vertical line shows the 50% completeness limit at log F [erg s−1 cm−2]= − 17.75 and the dashed vertical line shows the analytically approximated minimum line flux given in Eq. (2) as log Fline [erg s−1 cm−2] ≈ − 17.69 at which LSDCat is expected to detect emission line sources in this experiment.
Current usage metrics show cumulative count of Article Views (full-text article views including HTML views, PDF and ePub downloads, according to the available data) and Abstracts Views on Vision4Press platform.
Data correspond to usage on the plateform after 2015. The current usage metrics is available 48-96 hours after online publication and is updated daily on week days.
Initial download of the metrics may take a while.