Fig. D.2
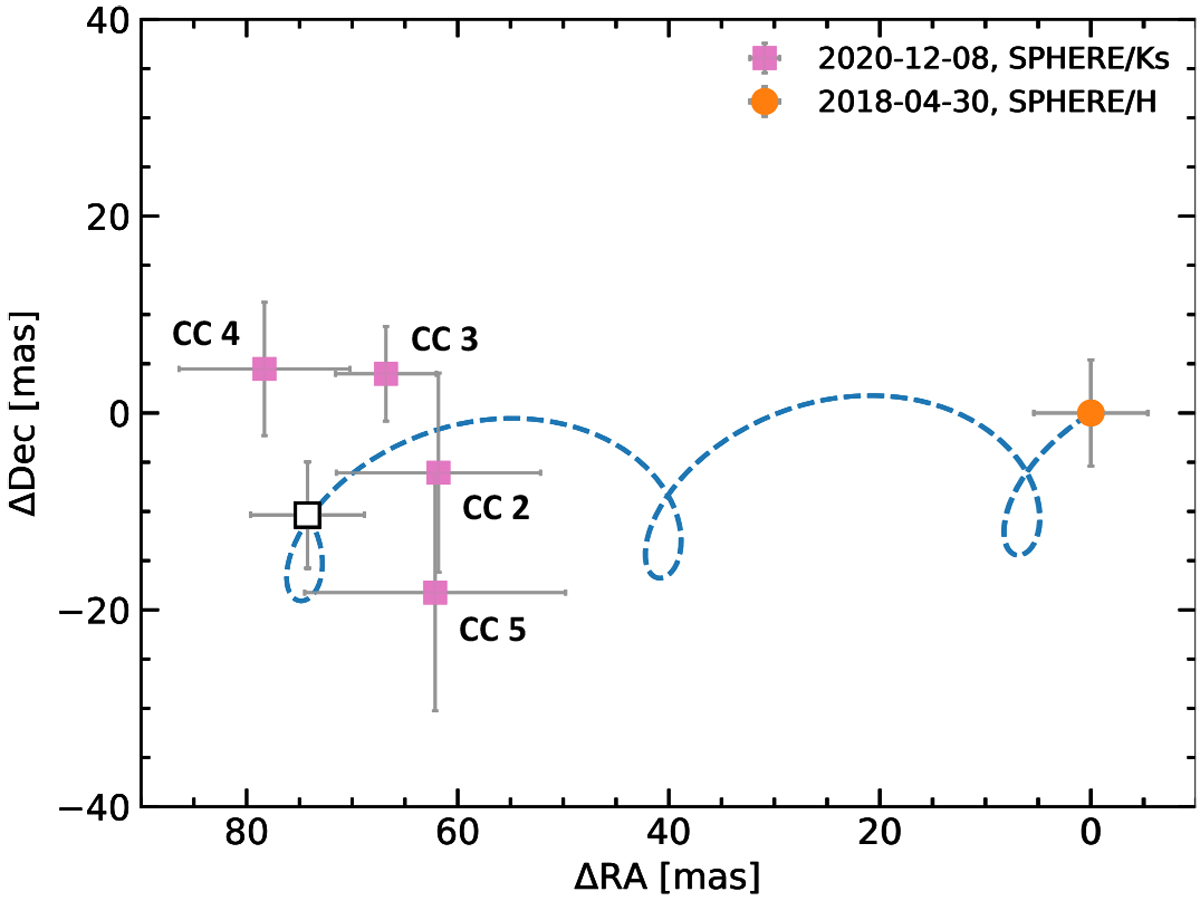
Proper motion plot for background objects in the SPHERE/IRDIS field of view. The pink markers indicate the relative astrometric offsets to the first observational epoch that is plotted at the origin of the coordinate system (orange marker). The blue trajectory represents the simulated motion of a static background object at infinity and the white marker shows the relative positional offset of such an object at the time of our second observation.
Current usage metrics show cumulative count of Article Views (full-text article views including HTML views, PDF and ePub downloads, according to the available data) and Abstracts Views on Vision4Press platform.
Data correspond to usage on the plateform after 2015. The current usage metrics is available 48-96 hours after online publication and is updated daily on week days.
Initial download of the metrics may take a while.