Fig. 2.
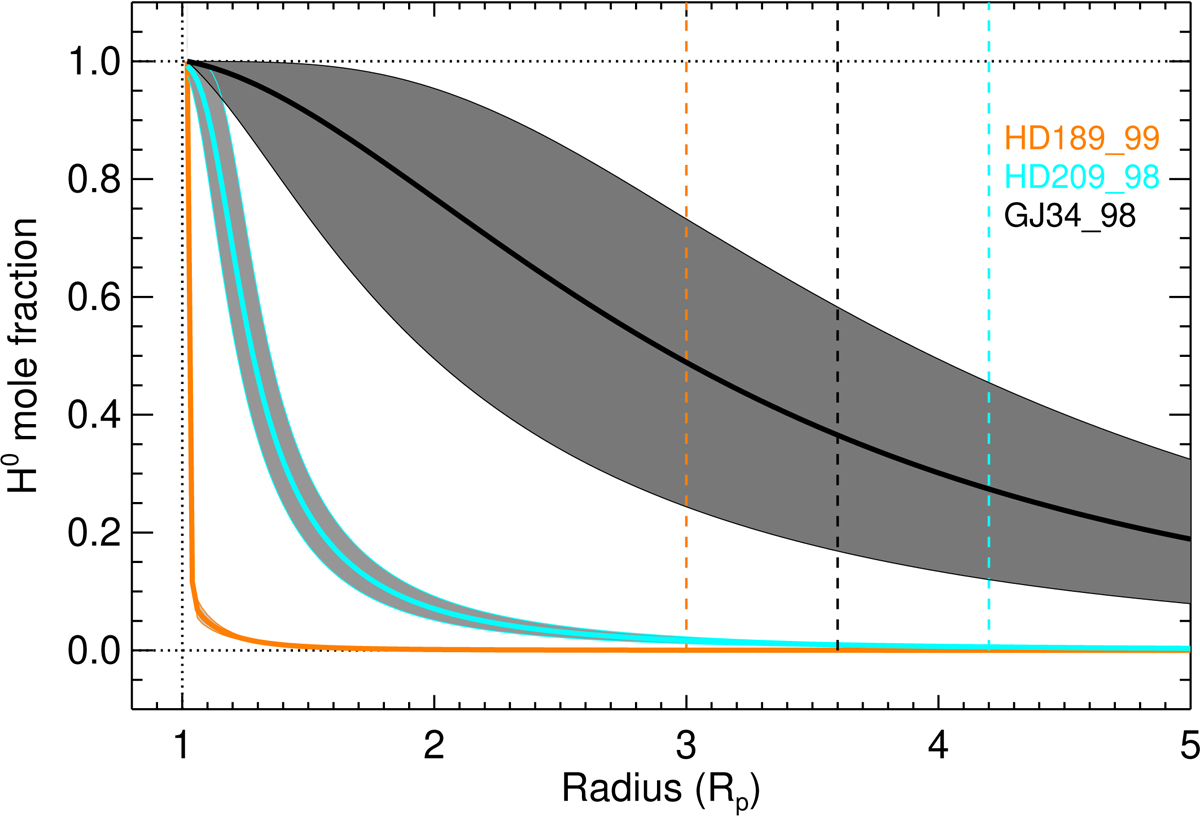
Neutral H mole fraction profiles resulting from the measured He(23S) and Lyα absorption spectra for HD 189733 b, HD 209458 b, and GJ 3470 b with the representative H/He ratios of 99/1, 98/2, and 98/2, respectively. The grey shaded areas correspond to the temperature and mass-loss rate ranges (symbols) in Fig. 1. The thicker solid lines are the mean profiles. The vertical dashed lines indicate the mean Roche lobes.
Current usage metrics show cumulative count of Article Views (full-text article views including HTML views, PDF and ePub downloads, according to the available data) and Abstracts Views on Vision4Press platform.
Data correspond to usage on the plateform after 2015. The current usage metrics is available 48-96 hours after online publication and is updated daily on week days.
Initial download of the metrics may take a while.