Fig. 4
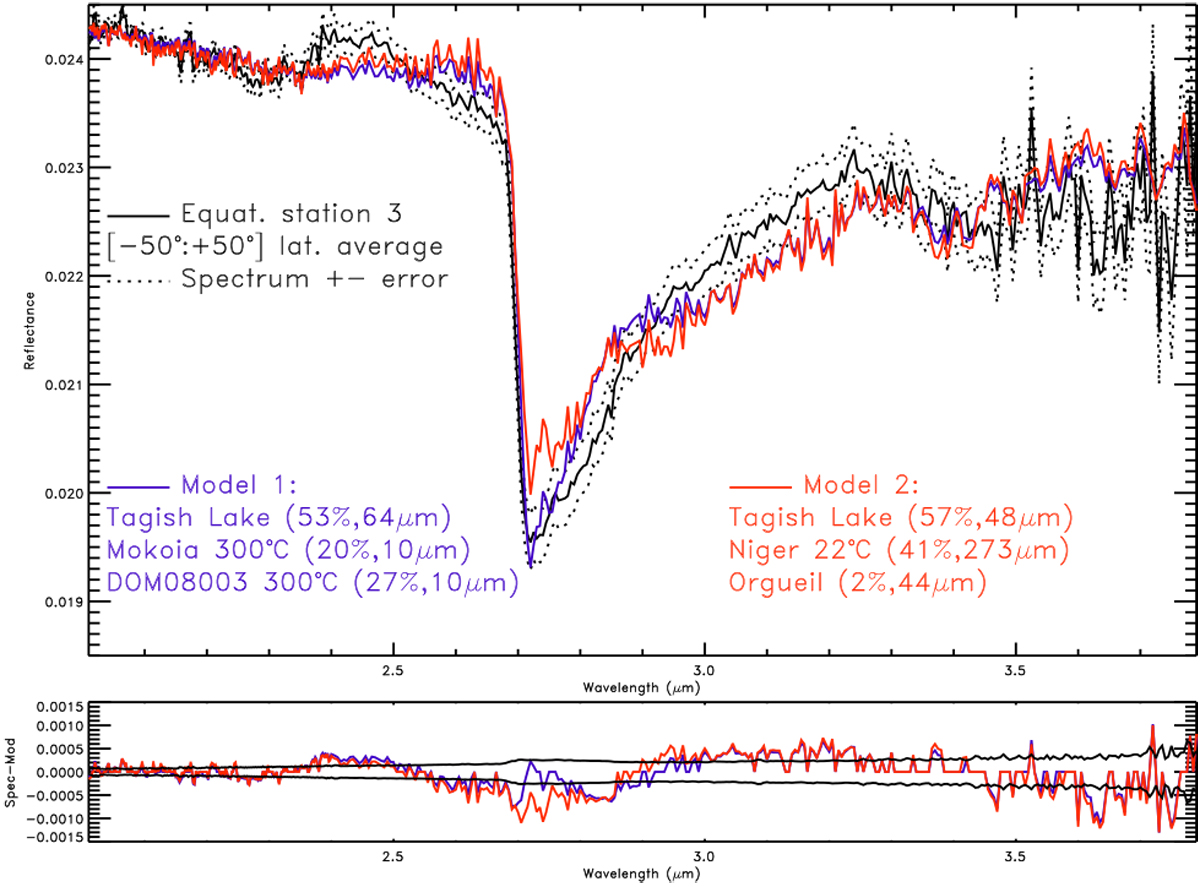
Top: sample of two fits of Bennu (in color), for which the reduced χ2 ~ 2.8–3.5. Thesynthetic spectra were generated using an intimate mixtures of small particles of Tagish Lake (desiccated at 102° C) mixed with other small constituents such as DOM 08003 and Mokoia (model 1), or mixed with larger particles of Niger (at 22° C) (model 2). The average spectrum of Bennu is shown by the solid black line, and errors appear as dotted black lines. Bottom: representation of Bennu spectrum minus the synthetic spectra (in color), compared with the computed error of the Bennu spectrum (in black).
Current usage metrics show cumulative count of Article Views (full-text article views including HTML views, PDF and ePub downloads, according to the available data) and Abstracts Views on Vision4Press platform.
Data correspond to usage on the plateform after 2015. The current usage metrics is available 48-96 hours after online publication and is updated daily on week days.
Initial download of the metrics may take a while.