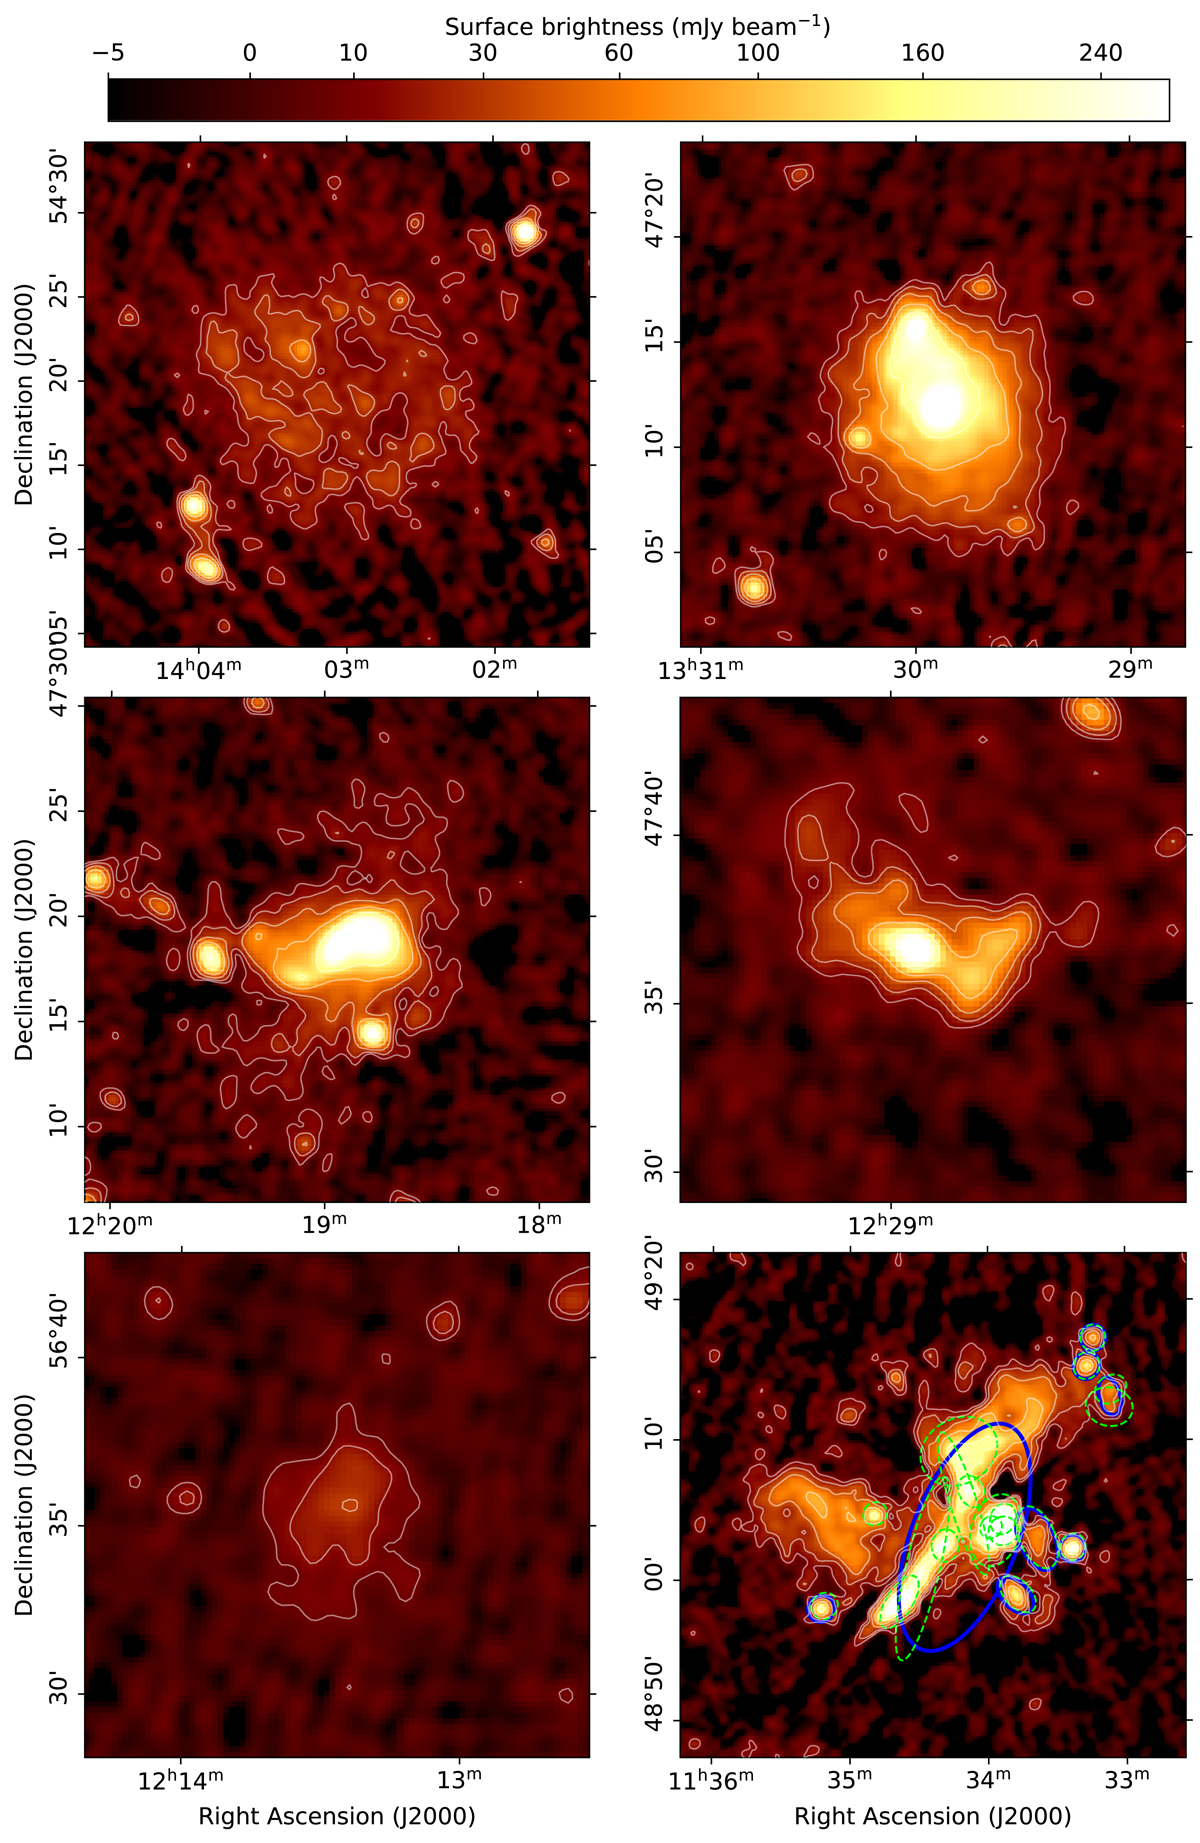
Fig. 13.

Some examples of extended sources in the data release published with this paper. From top-left to bottom-right, the nearby galaxies M101, M51, M106, the galaxy cluster Abell 1550, the emission surrounding the early type galaxy MCG+10-18-009, and the complex blend of emission coming from both AGN activity and diffuse sources in the ICM in Abell 1314. Contours start at three times the local rms noise. In the last panel, the green dashed lines show the gaussians used by the source finder to model the brightness distribution of the radio sources, the blue regions show the location and size of the sources, composed by one or more Gaussian components, as they are present in the catalogue.
Current usage metrics show cumulative count of Article Views (full-text article views including HTML views, PDF and ePub downloads, according to the available data) and Abstracts Views on Vision4Press platform.
Data correspond to usage on the plateform after 2015. The current usage metrics is available 48-96 hours after online publication and is updated daily on week days.
Initial download of the metrics may take a while.


